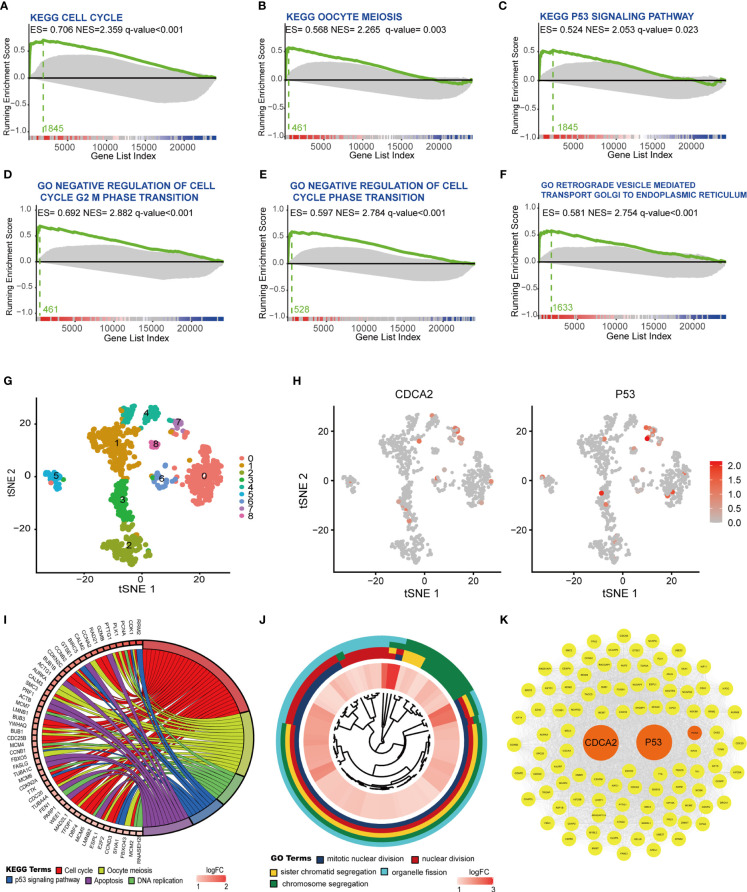
Figure 7.
Cell division cycle associated 2 (CDCA2) was associated with the p53 signaling and the expression of P53. (A–F) Analysis of CDCA2 correlation with Kyoto Encyclopedia of Genes and Genomes (KEGG) and Gene Ontology (GO) gene sets was performed by the R software with gene set enrichment analysis (GSEA) package in The Cancer Genome Atlas (TCGA) database. Enrichment score (ES), normalized enrichment score (NES), and q values were shown in each vignette with the Zero cross at 13357. (G) Hepatocellular carcinoma (HCC) cells were delineated into nine clusters, from 0 to 8, shown in different colors with the R software with Seurat package, respectively. (H) Application of red to highlight the distribution of CDCA2 and p53 expression in different clusters in the tSNE map. (I, J) KEGG pathway and GO enrichment analysis of marker genes in cluster 7. (K) Protein–protein interaction (PPI) relationship of core genes associated with CDCA2 and p53.

