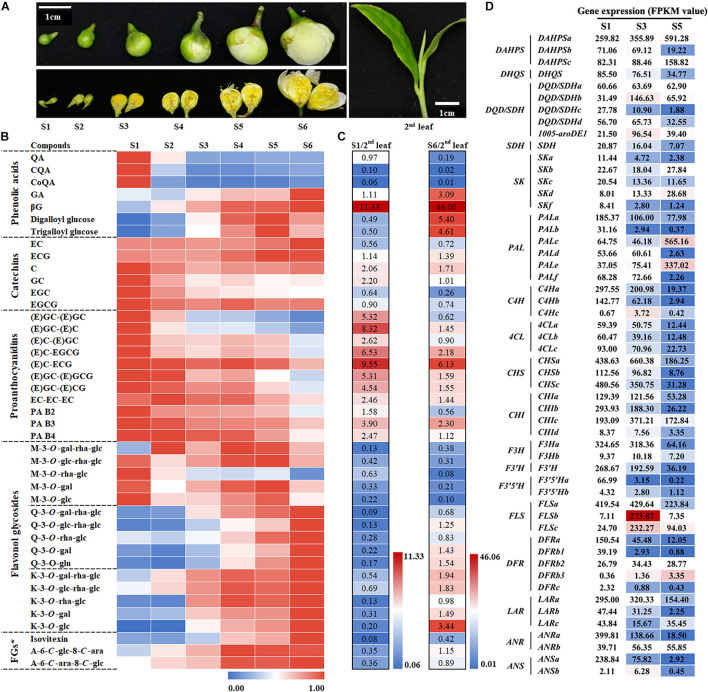
FIGURE 2.
Metabolic analysis of phenolic compounds and expression analysis of related biosynthetic genes at different flower bud developmental stages. (A) Phenotypes of different stages of flower buds and the second leaf. S1–S6 represent developmental stages 1–6, respectively. (B) Characteristics of phenolic compound accumulation in different flower developmental stages. The peak area data were processed and fall into an interval of 0–1 according to the ratio. FGs*, Flavone glycosides. (C) Comparison of the phenolic compound accumulation between S1 or S6 and the second leaf. (D) Expression analysis of genes in the shikimate, phenylpropanoid, and flavonoid pathways at different flower development stages. The value represents the FPKM value. The S1 FPKM value of each gene transcript was defined as numerical value 1, and the stage 3 and S5 FPKM values were converted proportionally.

