FIGURE 8.
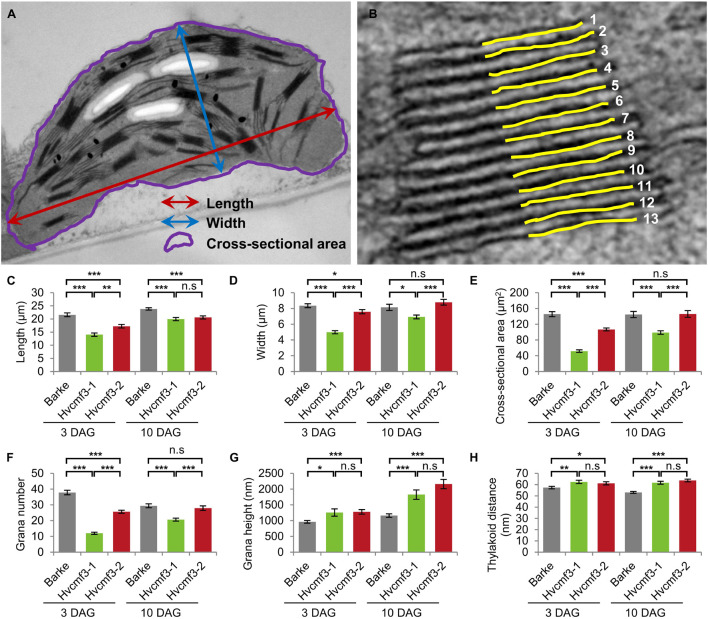
Quantification of chloroplast architecture components. (A) Diagram for demonstrating the chloroplast length, width, and surface area. (B) Illustration demonstrating the counting of thylakoid. (C–H) Comparison of chloroplast morphology and grana architecture between wild type and Hvcmf3 mutants at developmental stages 3 days after germination. Chloroplast length (C), chloroplast width (D), chloroplast cross-sectional area (E), grana number (F), grana height (G), and thylakoid distance (H). Results are presented as means ± SE. t-test significant level: *p < 0.05; **p < 0.01; ***p < 0.001, n.s, not significant. Number of chloroplast analyzed n ≥ 24. The exact p-values are provided in Supplementary Dataset 6.

