Figure 4.
Somatic mutations identified in bile, plasma, and tissue samples.
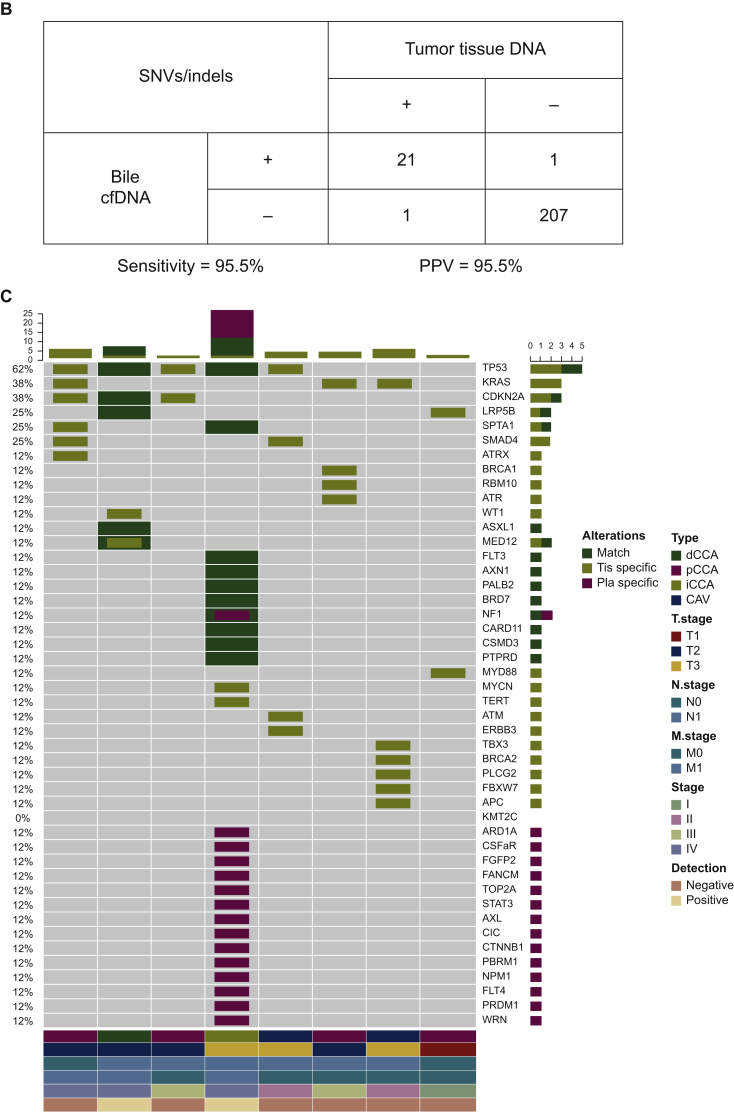
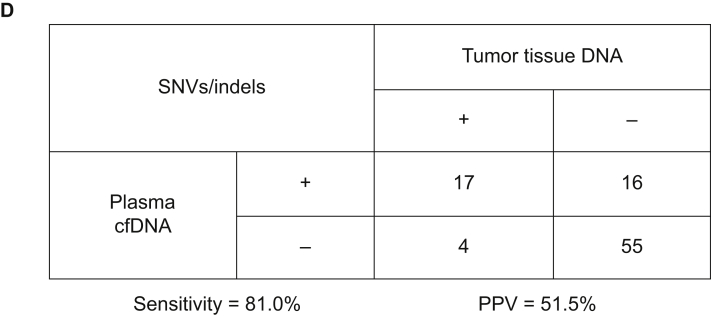
(A) Heatmap showing somatic mutations identified in bile and matched tissue samples. Dark green indicates mutations identified in both sources, olive green indicates mutations present only in the tissue samples, and dark blue indicates mutations present only in the bile samples. (B) The by-variant sensitivity and PPV of utilizing capture-based targeted sequencing to identify SNVs/indels in bile cfDNA were calculated, with tissue samples used as references. (C) Heatmap displaying somatic mutations identified in plasma and matched tissue samples. Dark green indicates mutations identified in both sources, olive green indicates mutations present only in the tissue samples, and maroon indicates mutations present only in the plasma samples. (D) The by-variant sensitivity and PPV of utilizing capture-based targeted sequencing to identify SNVs/indels in plasma cfDNA were calculated, with tissue samples used as references.
CAV, carcinoma of ampullar of Vater; cfDNA, cell-free DNA; dCCA, distal cholangiocarcinoma; iCCA, intrahepatic cholangiocarcinoma; indels, insertions and deletions; pCCA, perihilar cholangiocarcinoma; Pla, plasma; PPV, positive predictive value; SNVs, single-nucleotide variants; Tis, tumor tissue.


