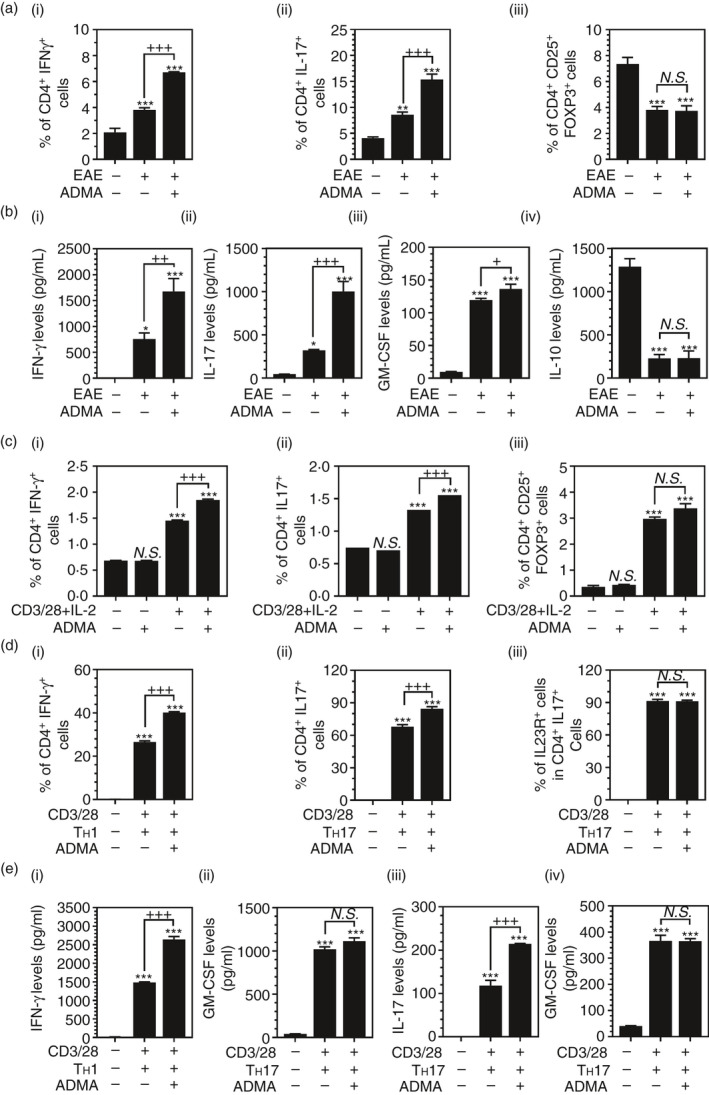
FIGURE 5.

ADMA treatment enhances TH1 and TH17 polarization: Female C57BL/6 mice were treated with complete Freund's adjuvant (CFA), myelin oligodendrocyte glycoprotein (MOG), and pertussis toxin (PTX) for induction of EAE with or without daily ADMA treatment starting the day of disease onset. At the peak of disease (day 19 post‐immunization), % of IFN‐γ+ TH1 cells (A‐i), IL‐17+ TH17 cells (A‐ii) and CD25hi FOXP3+ Treg cells (A‐iii) in the splenic CD4+ cells of control, EAE and ADMA‐treated EAE mice were analysed by fluorescence flow cytometry, and their secretion of IFN‐γ (B‐i), IL‐17a (B‐ii), GM‐CSF (B‐iii) and IL‐10 (B‐iv) was analysed by ELISA. Please see Figure S2 for the representative flow cytometry dot plots. The bar graphs on panels A and B represent mean ± standard error mean (SEM) from n = 4 animals. In vitro‐cultured naïve splenic CD4+ T cells were activated by IL‐2 (5 ng/ml), anti‐CD3 mAb (2 μg/ml) and anti‐CD28 mAb (1 μg/ml) under unpolarized conditions in the presence or absence of ADMA (400 μM) and % of IFN‐γ+ TH1 cells (C‐i), IL‐17+ TH17 cells (C‐ii) and CD25+ FOXP3+ Treg cells were analysed by fluorescence flow cytometry. In vitro‐cultured naïve splenic CD4+ T cells were activated by IL‐2 and anti‐CD3 and anti‐CD28 mAbs under TH1 (10 ng/ml IL‐12 and 1 ug/ml anti‐IL‐4 mAb)‐ or TH17 (30ng/ml IL‐6, 2ng/ml TGF‐β, 5ng/ml IL‐23, 1ug/ml anti‐IFN‐γ mAb, 1ug/ml anti‐IL‐4 mAb)‐polarized conditions in the presence or absence of ADMA and % of IFN‐γ+ TH1 cells (D‐i) and IL‐17+ TH17 cells (D‐ii) in CD4+ T cells, and % of IL‐23Rhi cells in TH17 cells (D‐iii) were analysed by fluorescence flow cytometry. Please see Figure S3 for the representative flow cytometry dot plots. Under the same experimental conditions, T‐cell secretions of IFN‐γ and GM‐CSF under TH1‐polarized conditions (E‐i and ii) and secretions of IL‐17a and GM‐CSF under TH17‐polarized conditions (E‐iii and iv) were analysed by ELISA. The bar graphs on panels C, D and E represent mean ± standard error mean (SEM) from n = 3 independent cell cultures. N.S. (not significant: p ≥ 0·05); *p ≤ 0·05, **p ≤ 0·01, ***p ≤ 0·001 vs. control; +p ≤ 0·05, ++p ≤ 0·01, +++p ≤ 0·001 vs. as indicated
