FIGURE 5.

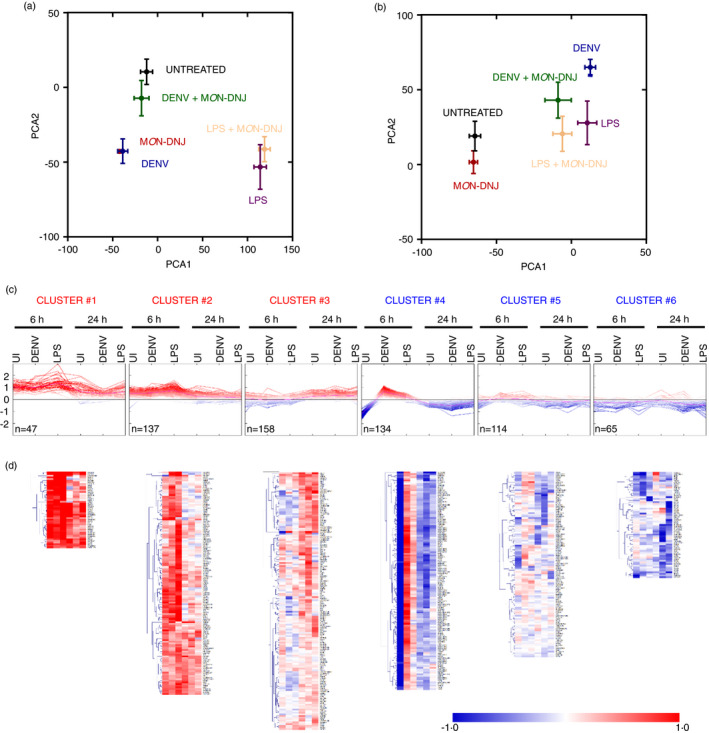
Characterization of MON‐DNJ transcriptomic effects. Principal component analysis (PCA) of all expressed transcripts at 6 h p.i. (a) and 24 h p.i. (b) was performed in ClustVis. Unit variance scaling is applied to rows, and singular value decomposition is used to calculate principal components. X‐ and Y‐axes show principal component 1 (PCA1) and principal component 2 (PCA2) that explain 54 per cent and 36 per cent of the total variance, respectively. Error bars represent standard error. (c) The 655 transcripts (324 genes, Table S2) with the greatest differential expression in our dataset (as described in Figure S1b) were subjected to K means clustering into 6 groups based on Euclidean distance. Expression patterns are noted with fold change (log2) for MON‐DNJ treatment relative to each untreated infection condition at each time point displayed on the x‐axis as an averaged value of n = 5 biological replicates. Individual transcripts are represented by a single line, and colour further represents magnitude of fold change such that darkest red is ≥1 log2 induction with MON‐DNJ relative to untreated and darkest blue is ≥1 log2 down‐regulation with MON‐DNJ relative to untreated. (d) Unsupervised hierarchical clustering (Euclidean distance, complete linkage) was performed on the clusters. Average fold change (log2) in gene expression of n = 5 biological replicates with iminosugar treatment is represented by a single coloured box
