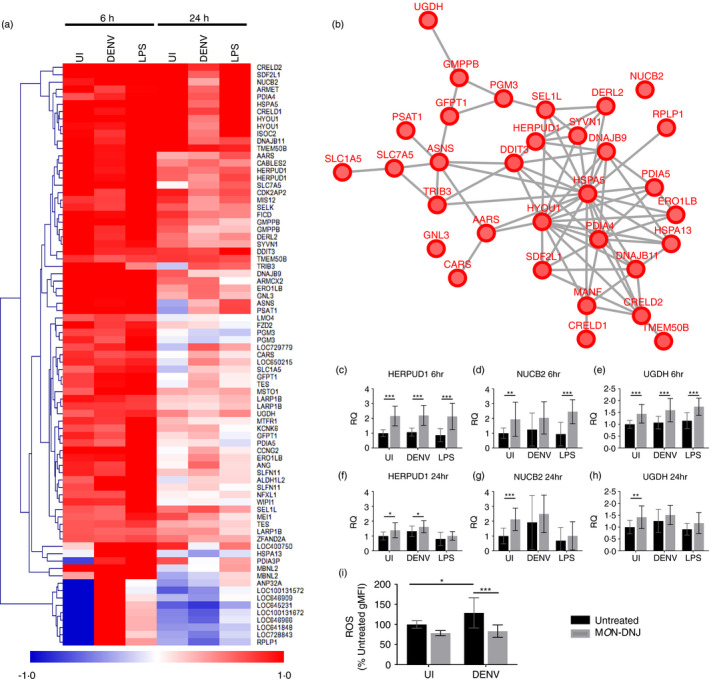
FIGURE 8.

The unfolded protein response is induced by MON‐DNJ. (a) Heatmap of MON‐DNJ modulated transcripts. Genes for clustering were identified as described in Figure S1b. Average fold change (log2) in gene expression of n = 5 biological replicates of MON‐DNJ treatment in comparison with infection and time‐matched controls is represented by a single coloured box. (b) STRING‐DB network of the genes listed in (a). Interactions curated in STRING‐DB are represented by lines between nodes for all interaction scores >0·4. (c–h) Selected transcripts were assayed by qRT‐PCR to confirm differential regulation observed by microarray. Macrophages from n = 4 donors were infected and treated with control (black bars) or 25 μM MON‐DNJ (grey bars) in duplicate and RNA was collected and assayed by qRT‐PCR in technical duplicate. Holm–Šídák correction for multiple comparisons was performed to identify statistically significant differences. All error bars represent standard deviation. RQ = relative quantity based on normalization to unmodulated transcript RPLP2. (a) Reactive oxygen species (ROS) generated in macrophages at 18 h p.i. was assessed using a flow cytometry‐based detection assay. Biological replicates (n = 3) were measure in technical triplicate, and all samples generated for a given donor were normalized to the uninfected, untreated control (black bar, UI). Two‐way ANOVA with Holm–Šídák correction for multiple comparisons was performed to identify statistically significant differences. *p < 0·05, **p < 0·01, ***p < 0·001
