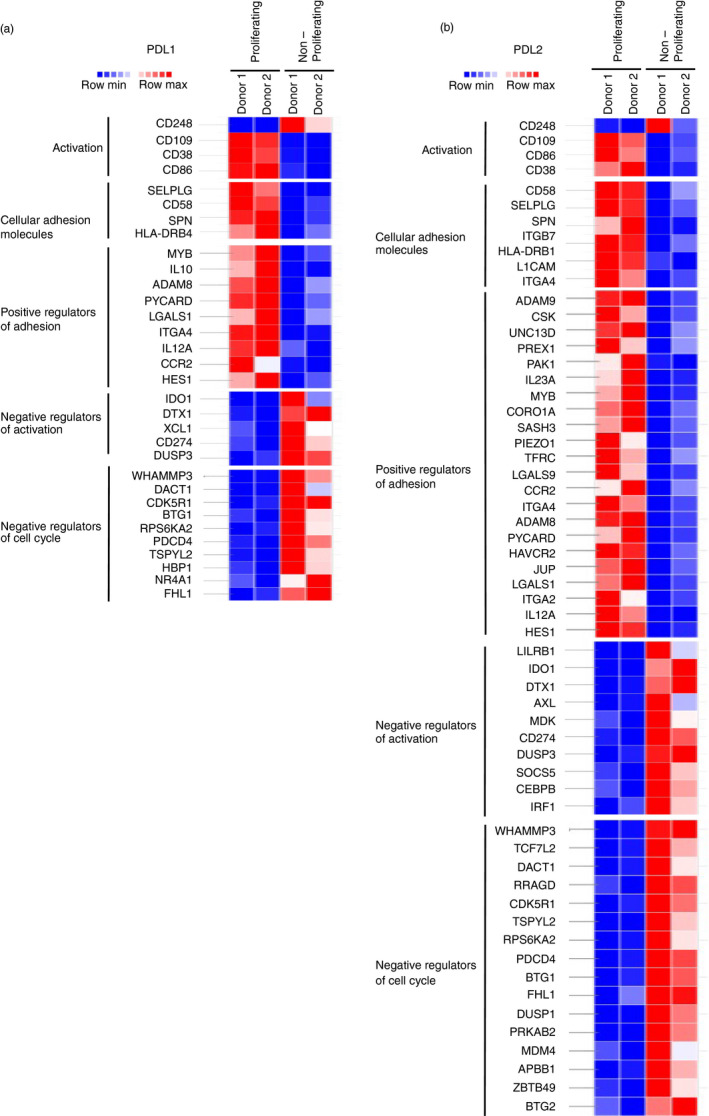
FIGURE 2.

T cells that proliferate following PDL1/L2 stimulation have an activated transcriptional signature. (a‐b) Heatmap displaying significant DEG between proliferating and non‐proliferating cells stimulated with anti‐CD3, anti‐CD28, and PDL1 or PDL2 that are within the indicated gene sets. Thresholds are set at adjusted P‐value 0·02 and log2 fold change ±1
