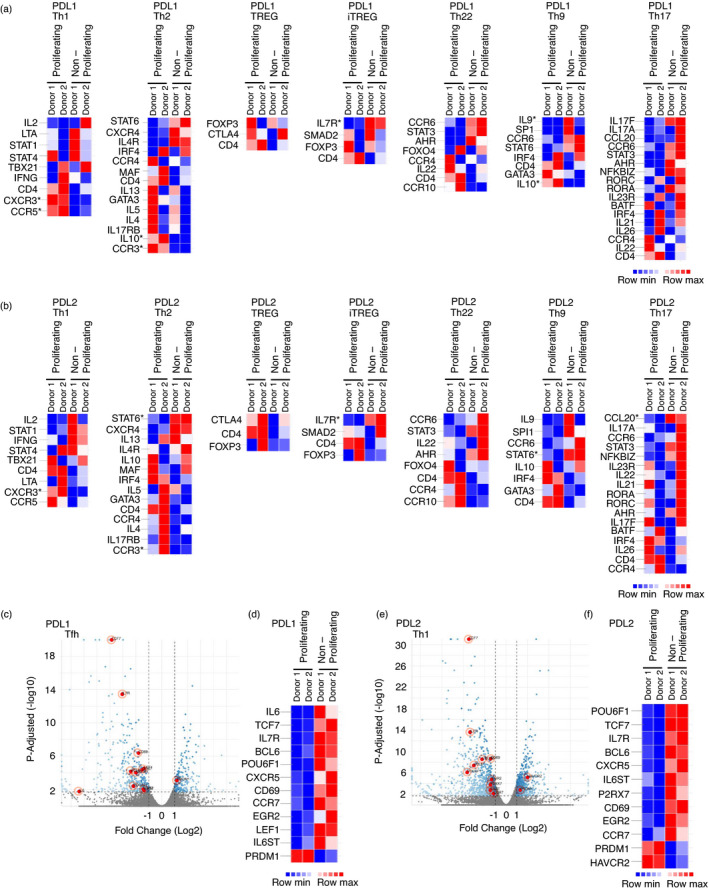
FIGURE 4.

T cells that proliferate following PDL1/L2 stimulation have decreased expression of Tfh cell associated genes. (a‐b) Heatmaps displaying DEG between proliferating and non‐proliferating cells stimulated with anti‐CD3, anti‐CD28, and PDL1 or PDL2. Thresholds are set at log2 fold change ±1, and significant DEG with adjusted P‐value 0·02 are indicated by *. (c–d) Volcano plot (c) displaying DEG between proliferating and non‐proliferating cells stimulated with anti‐CD3, anti‐CD28 and PDL1. Thresholds are set at adjusted P‐value 0·02 and log2 fold change ±1, and significant DEG are in blue. DEG from the Tfh subset are indicated in red with those that are significant shown in the heatmap (d). (e–f). Volcano plot (e) displaying DEG between proliferating and non‐proliferating cells stimulated with anti‐CD3, anti‐CD28 and PDL2. Thresholds are set at adjusted P‐value 0·02 and log2 fold change ±1, and significant DEG are in blue. DEG from the Tfh subset are indicated in red with those that are significant shown in the heatmap (f).
