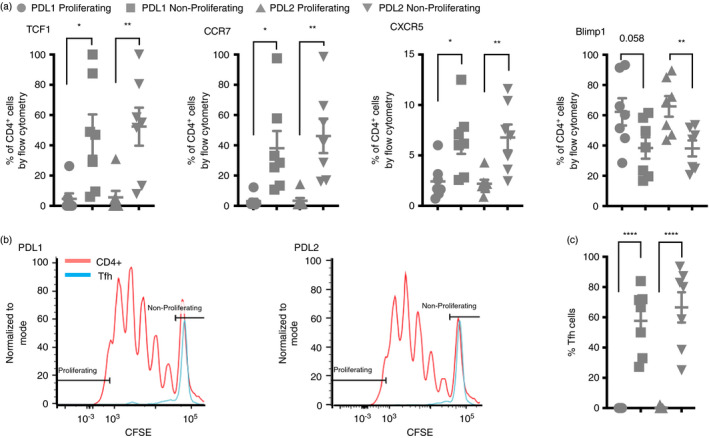
FIGURE 5.

Tfh cell‐associated proteins are enriched within the proliferating population. (a) Flow cytometry data with events first gated on CD3+ events followed by CD4+ events followed by CFSE expression level. Proliferating cells were gated as the top 5% of proliferating cells based on CFSE fluorescent intensity. Shown is the per cent of CD4+ cells positive for each of the indicated proteins that were proliferating or non‐proliferating. Note TCF1 protein is encoded for by TCF7, and Blimp1 protein is encoded for by PRDM1. (b) Flow cytometry data with events again gated on CD3+ events followed by CD4+ events then CCR7+CXCR5+TCF1+Blimp1− to identify the Tfh cells. CFSE fluorescence is shown to compare proliferation of the total CD4+ population to the Tfh population. (c) The percent of cells from the identified Tfh population that were proliferating (top 5%) or non‐proliferating. *P ≤ 0·05, **P ≤ 0·01
