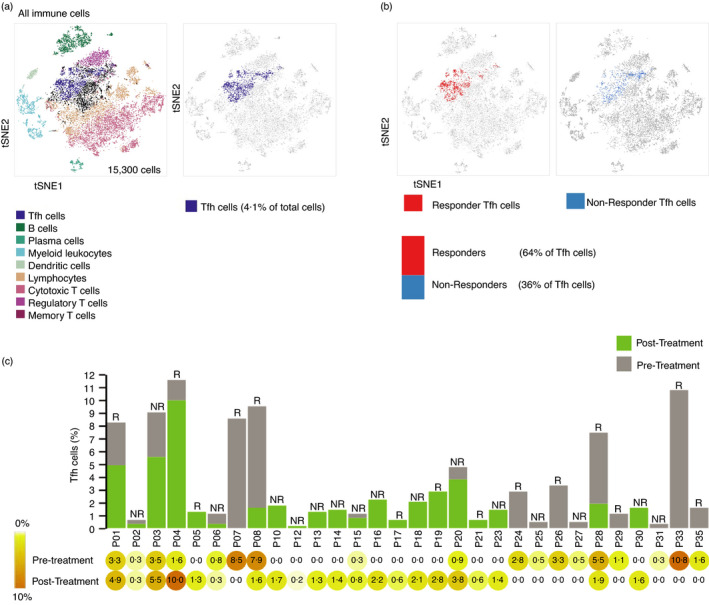
FIGURE 6.

Patients that respond favourably to PD‐1 blockade have more Tfh cells. (a) tSNE (t‐distributed stochastic neighbour embedding) plot of CD45+ cells of melanoma tumours from patients treated with pembrolizumab retrieved from data set GSE120575. Different colours represent 9 clusters (cell types) defined by Bio Turing Browser. Position of Tfh cells from the tSNE plot is shown in purple. (b) tSNE plots of Tfh cells corresponding to responders (red; left) and non‐responders (blue; right), respectively. Bar representing the percentage of Tfh cells among responders vs. non‐responders is shown. (c) Bar graph representing Tfh cell counts as per cent of total cell counts, with pre‐ and post‐treatment values indicated as grey and green, respectively. R = responder, NR = non‐responder. % values are shown beneath the bar graph in the heatmap
