Figure 2.

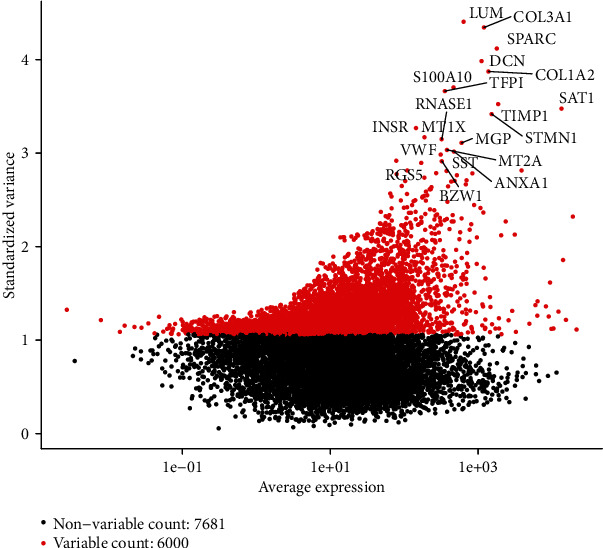
Detection of highly variable genes across the cells. x axis represents the average expression, and y axis represents standardized variance.

Detection of highly variable genes across the cells. x axis represents the average expression, and y axis represents standardized variance.