Figure 4.

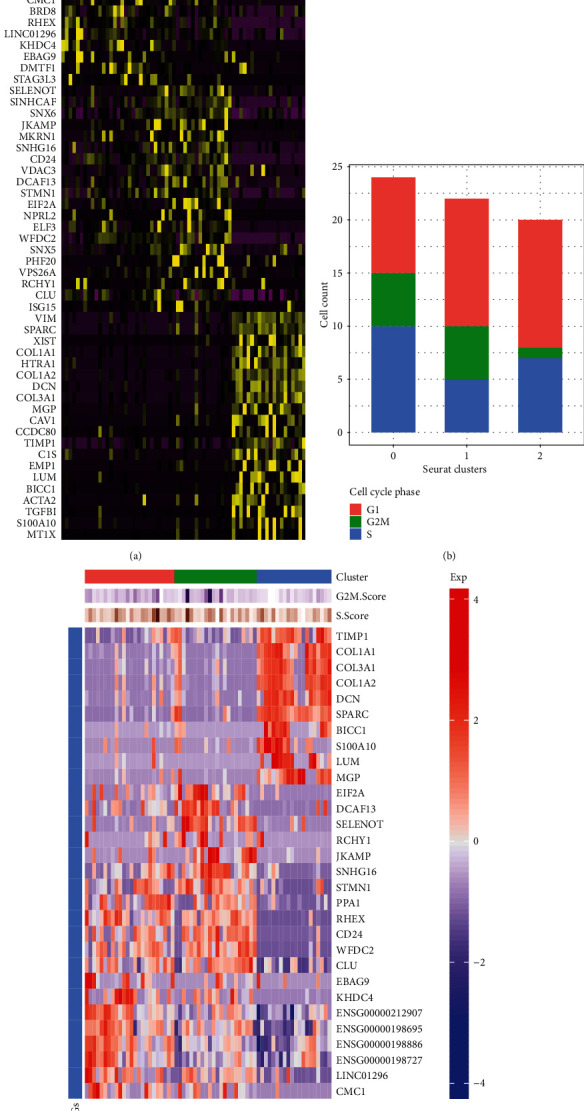
Cell cycle analyses. (a) The top 20 marker genes in the three cell subpopulations. (b) Cell cycle phase. (c) Cell cycle heatmap.

Cell cycle analyses. (a) The top 20 marker genes in the three cell subpopulations. (b) Cell cycle phase. (c) Cell cycle heatmap.