Figure 6.

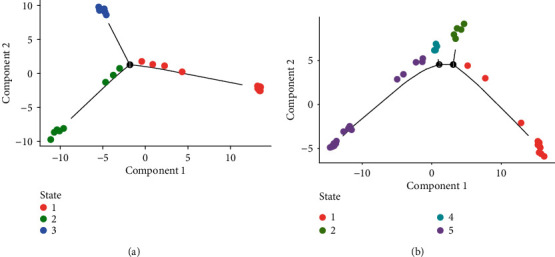
Reconstruction of differentiation trajectories to ovarian cancer. (a, b) The trajectory plot in pseudotime of epithelial cancer cells and stromal cells using Monocle analysis. Different colors represent different cell states.

Reconstruction of differentiation trajectories to ovarian cancer. (a, b) The trajectory plot in pseudotime of epithelial cancer cells and stromal cells using Monocle analysis. Different colors represent different cell states.