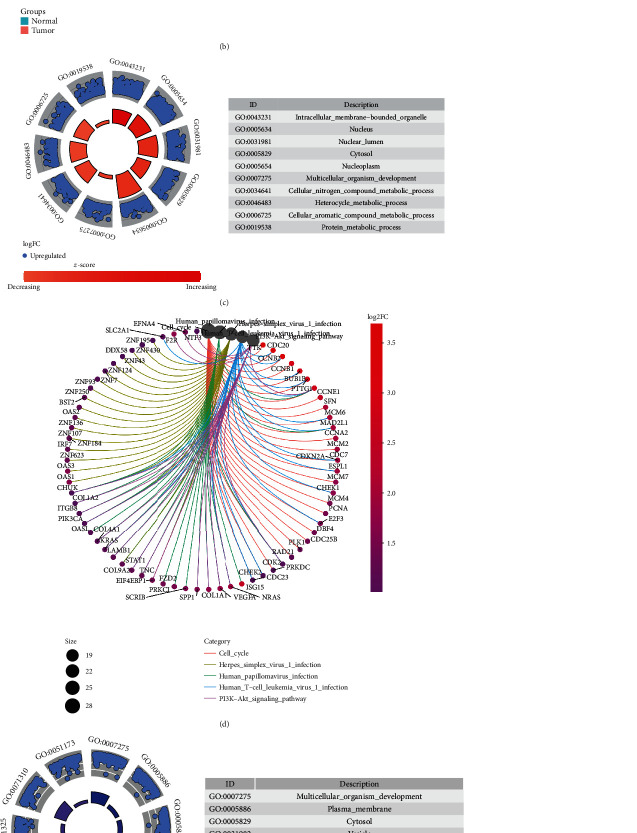
Figure 7.
Differentially expressed genes of ovarian cancer. (a, b) Volcano plots and heatmap showing the differentially expressed genes with ∣log2FC | >1 and adjusted p value <0.05 between ovarian cancer and normal tissues, respectively. (c, d) GO and KEGG enrichment analysis results of upregulated genes. (e, f) GO and KEGG enrichment analysis results of downregulated genes.

