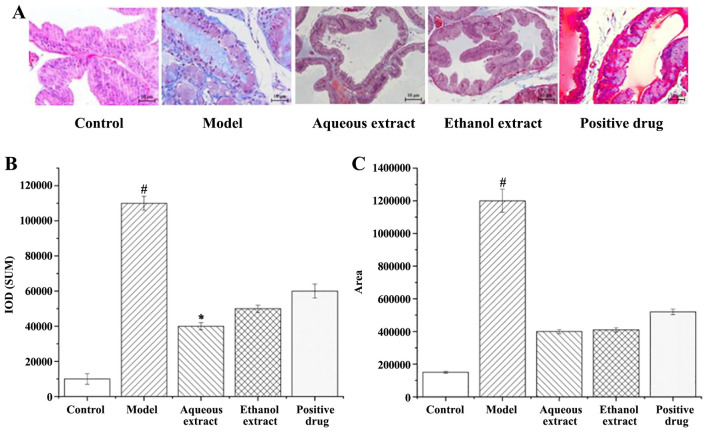
Figure 6.
Masson staining analysis following treatment with the different extraction and enrichment parts. (A) Masson staining results following treatment with the different extraction and enrichment parts. Magnification, x400. (B) Cumulative IOD following treatment with the different extraction and enrichment parts (n=8). (C) Fibrotic areas following treatment with the different extraction and enrichment parts (n=8). #P<0.05 vs. sham group; *P<0.05 vs. model group. IOD, integrated optical density.

