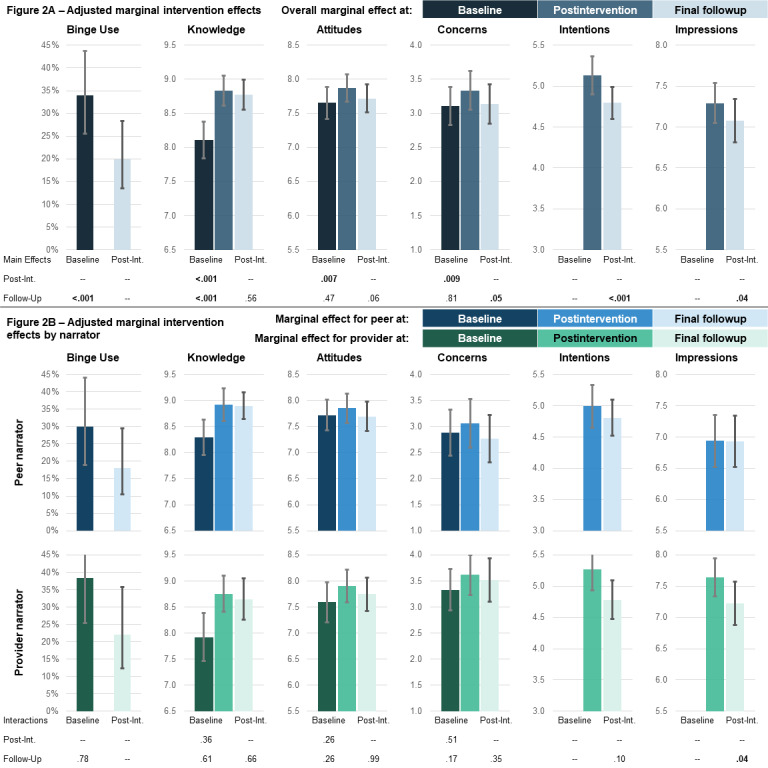
Figure 2.

Adjusted marginal intervention effects (y axis) both overall (A, main effects models) and by treatment arm (B, interaction models) across time points (x axis). Adjusted marginal means or probability and 95% CIs were output from multivariate mixed effects models as described in the Methods section. In panel A, the P values indicate the statistical significance for the overall intervention effect across time; for example, the intervention reduced the prevalence of binge drinking at final follow-up compared with baseline at P<.001. In panel B, the P values indicate the statistical significance for the difference in the intervention effect across time by arm (interaction); for example, the reduction in the prevalence of binge drinking at final follow-up compared with baseline was not significantly different by treatment arm at P=.78.
