
Fig. 3.
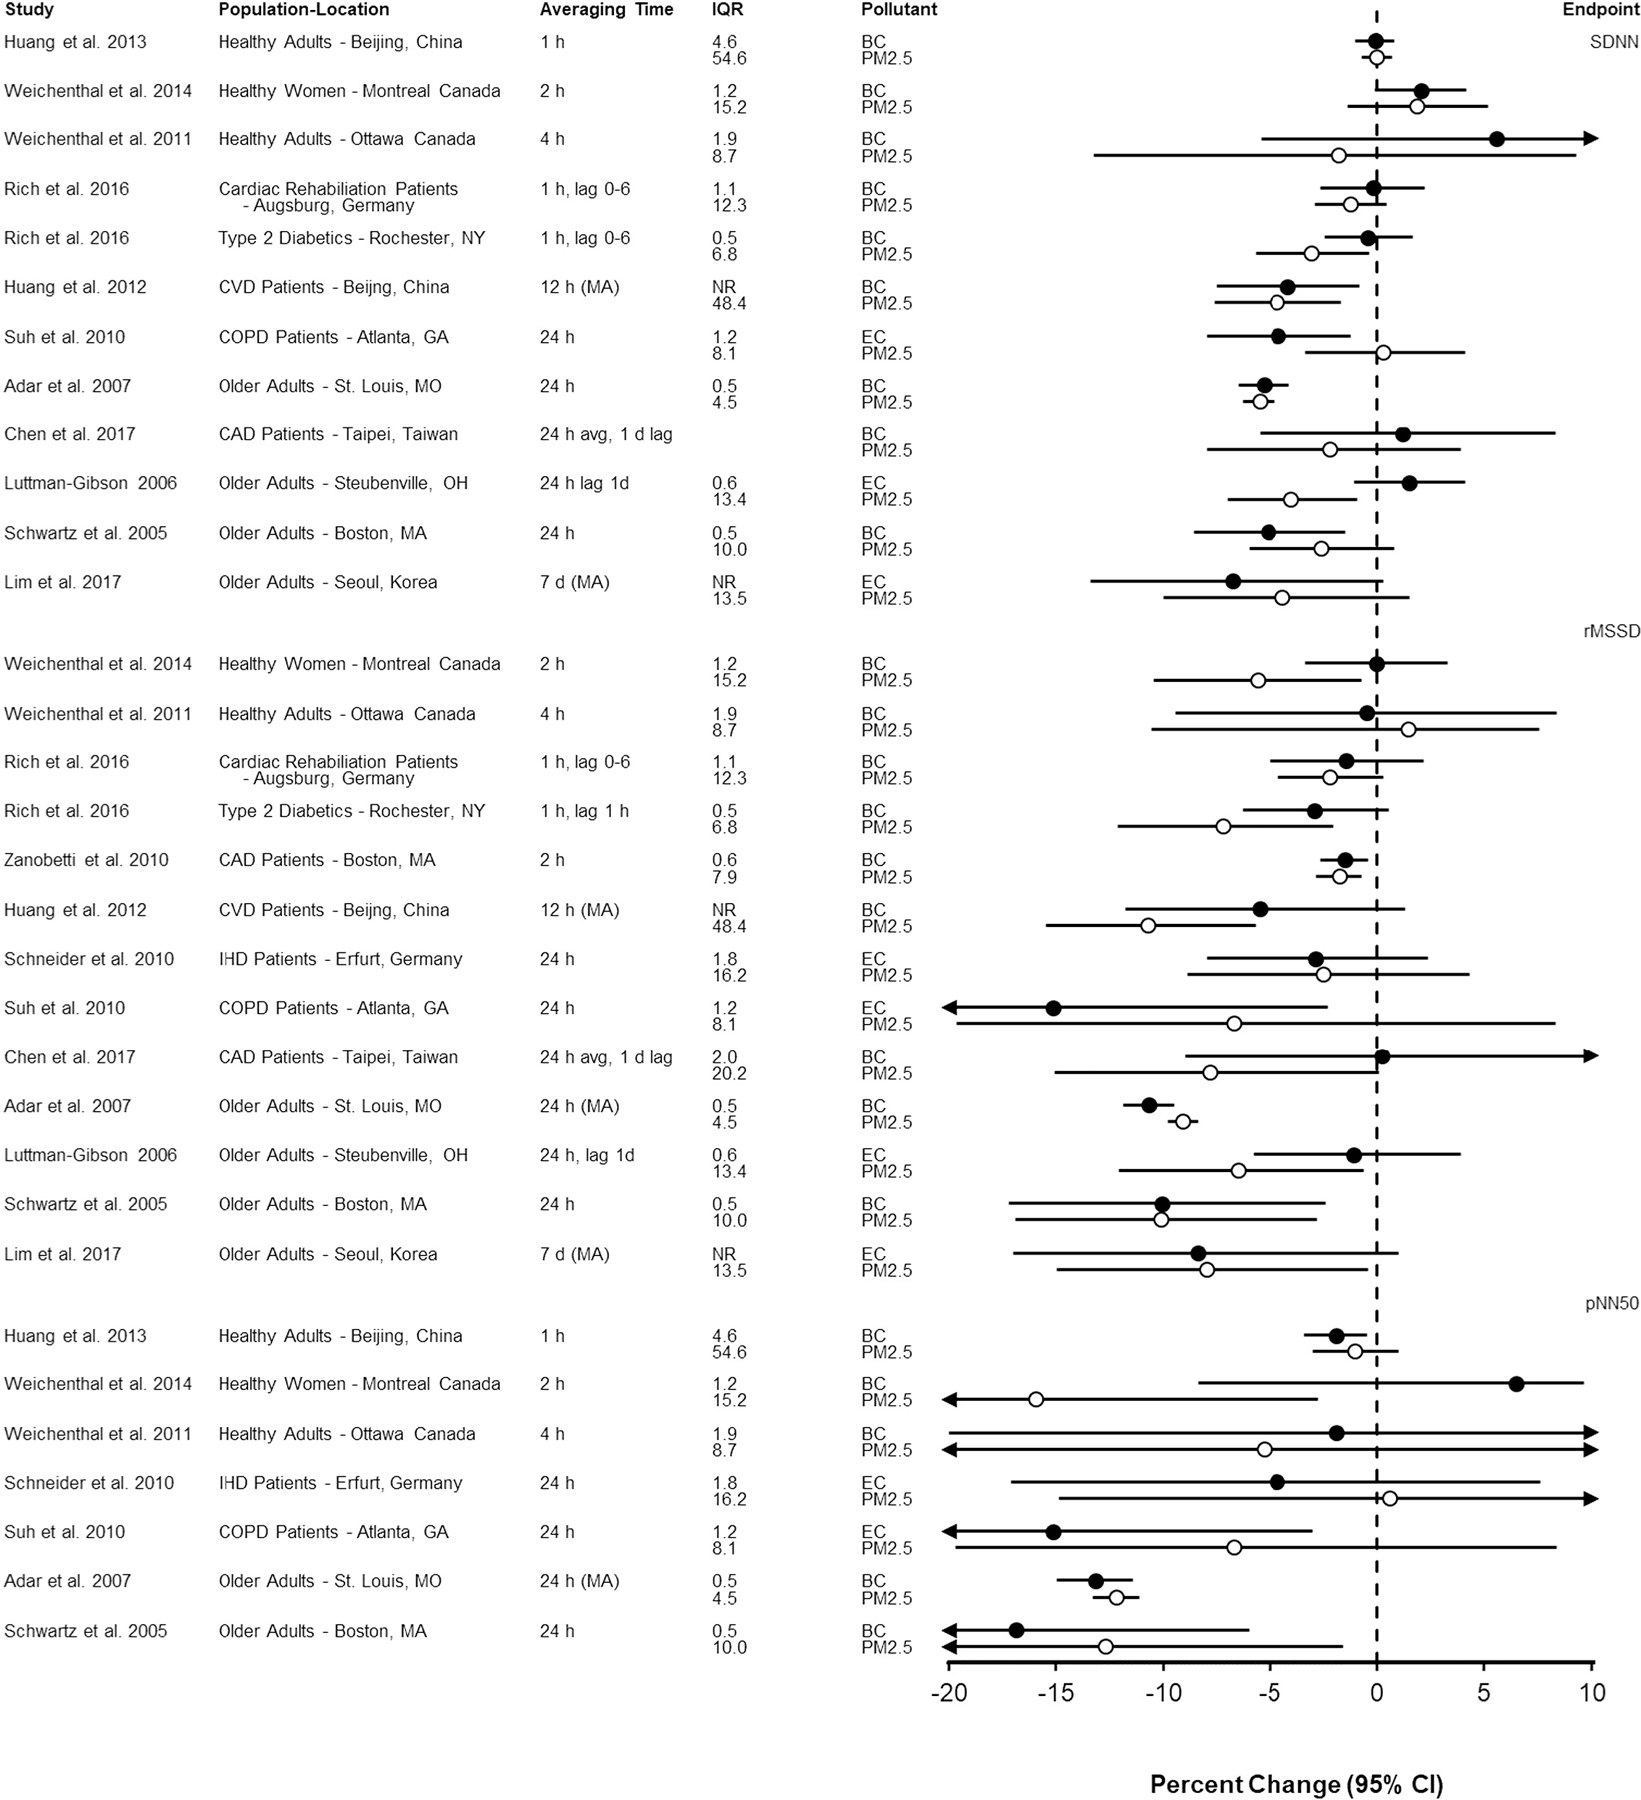
Association of short-term exposure to black carbon or elemental carbon (black circles) and particulate matter < 2.5 μm in diameter (open circles) with time domain measures of heart rate variability per interquartile range increase in mean (or median) pollutant concentration (in μg/m3). Studies are organized by endpoint (SDNN, rMSSD, pNN50), population type (i.e., healthy, pre-existing disease, older adults) and averaging time (i.e., shortest averaging time first). Circles represent point estimates and horizontal lines represent 95% confidence intervals. BC = black carbon; CAD = coronary artery disease; COPD = chronic obstructive pulmonary disease; CVD = cardiovascular disease; d = day; EC = elemental carbon; h = hour; IQR = interquartile range; MA = moving average; pNN50 = proportion of successive NNs that differ by > 50 ms; rMSSD = root mean-square of successive differences; SD: standard deviation; SDNN = standard deviation of all normal to-normal intervals.