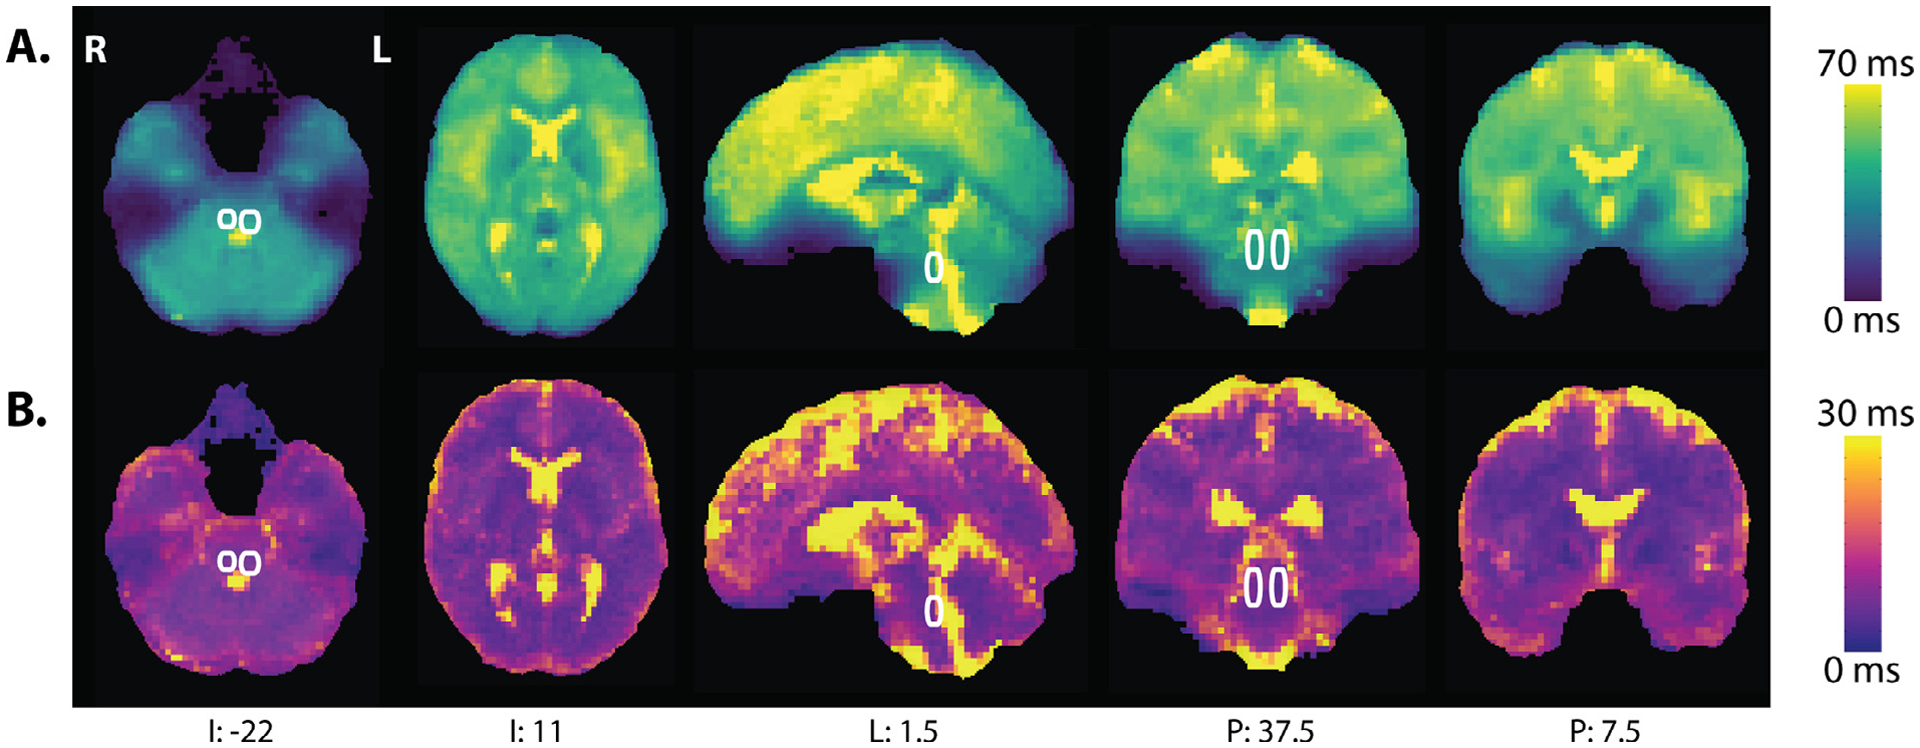
Fig. 4.

T2* map computed with t2smap.py as part of the meica.py pipeline. A) Mean observed T2* relaxation across participants. B) Standard deviation of observed T2* relaxation. The location of the LC, outlined in white, is based on the heat map of LC ROIs as illustrated in Figure 2. Data in MNIa, with coordinates in LPI. Descriptive statistics for various ROIs were calculated in native space.
