
Fig. 5.
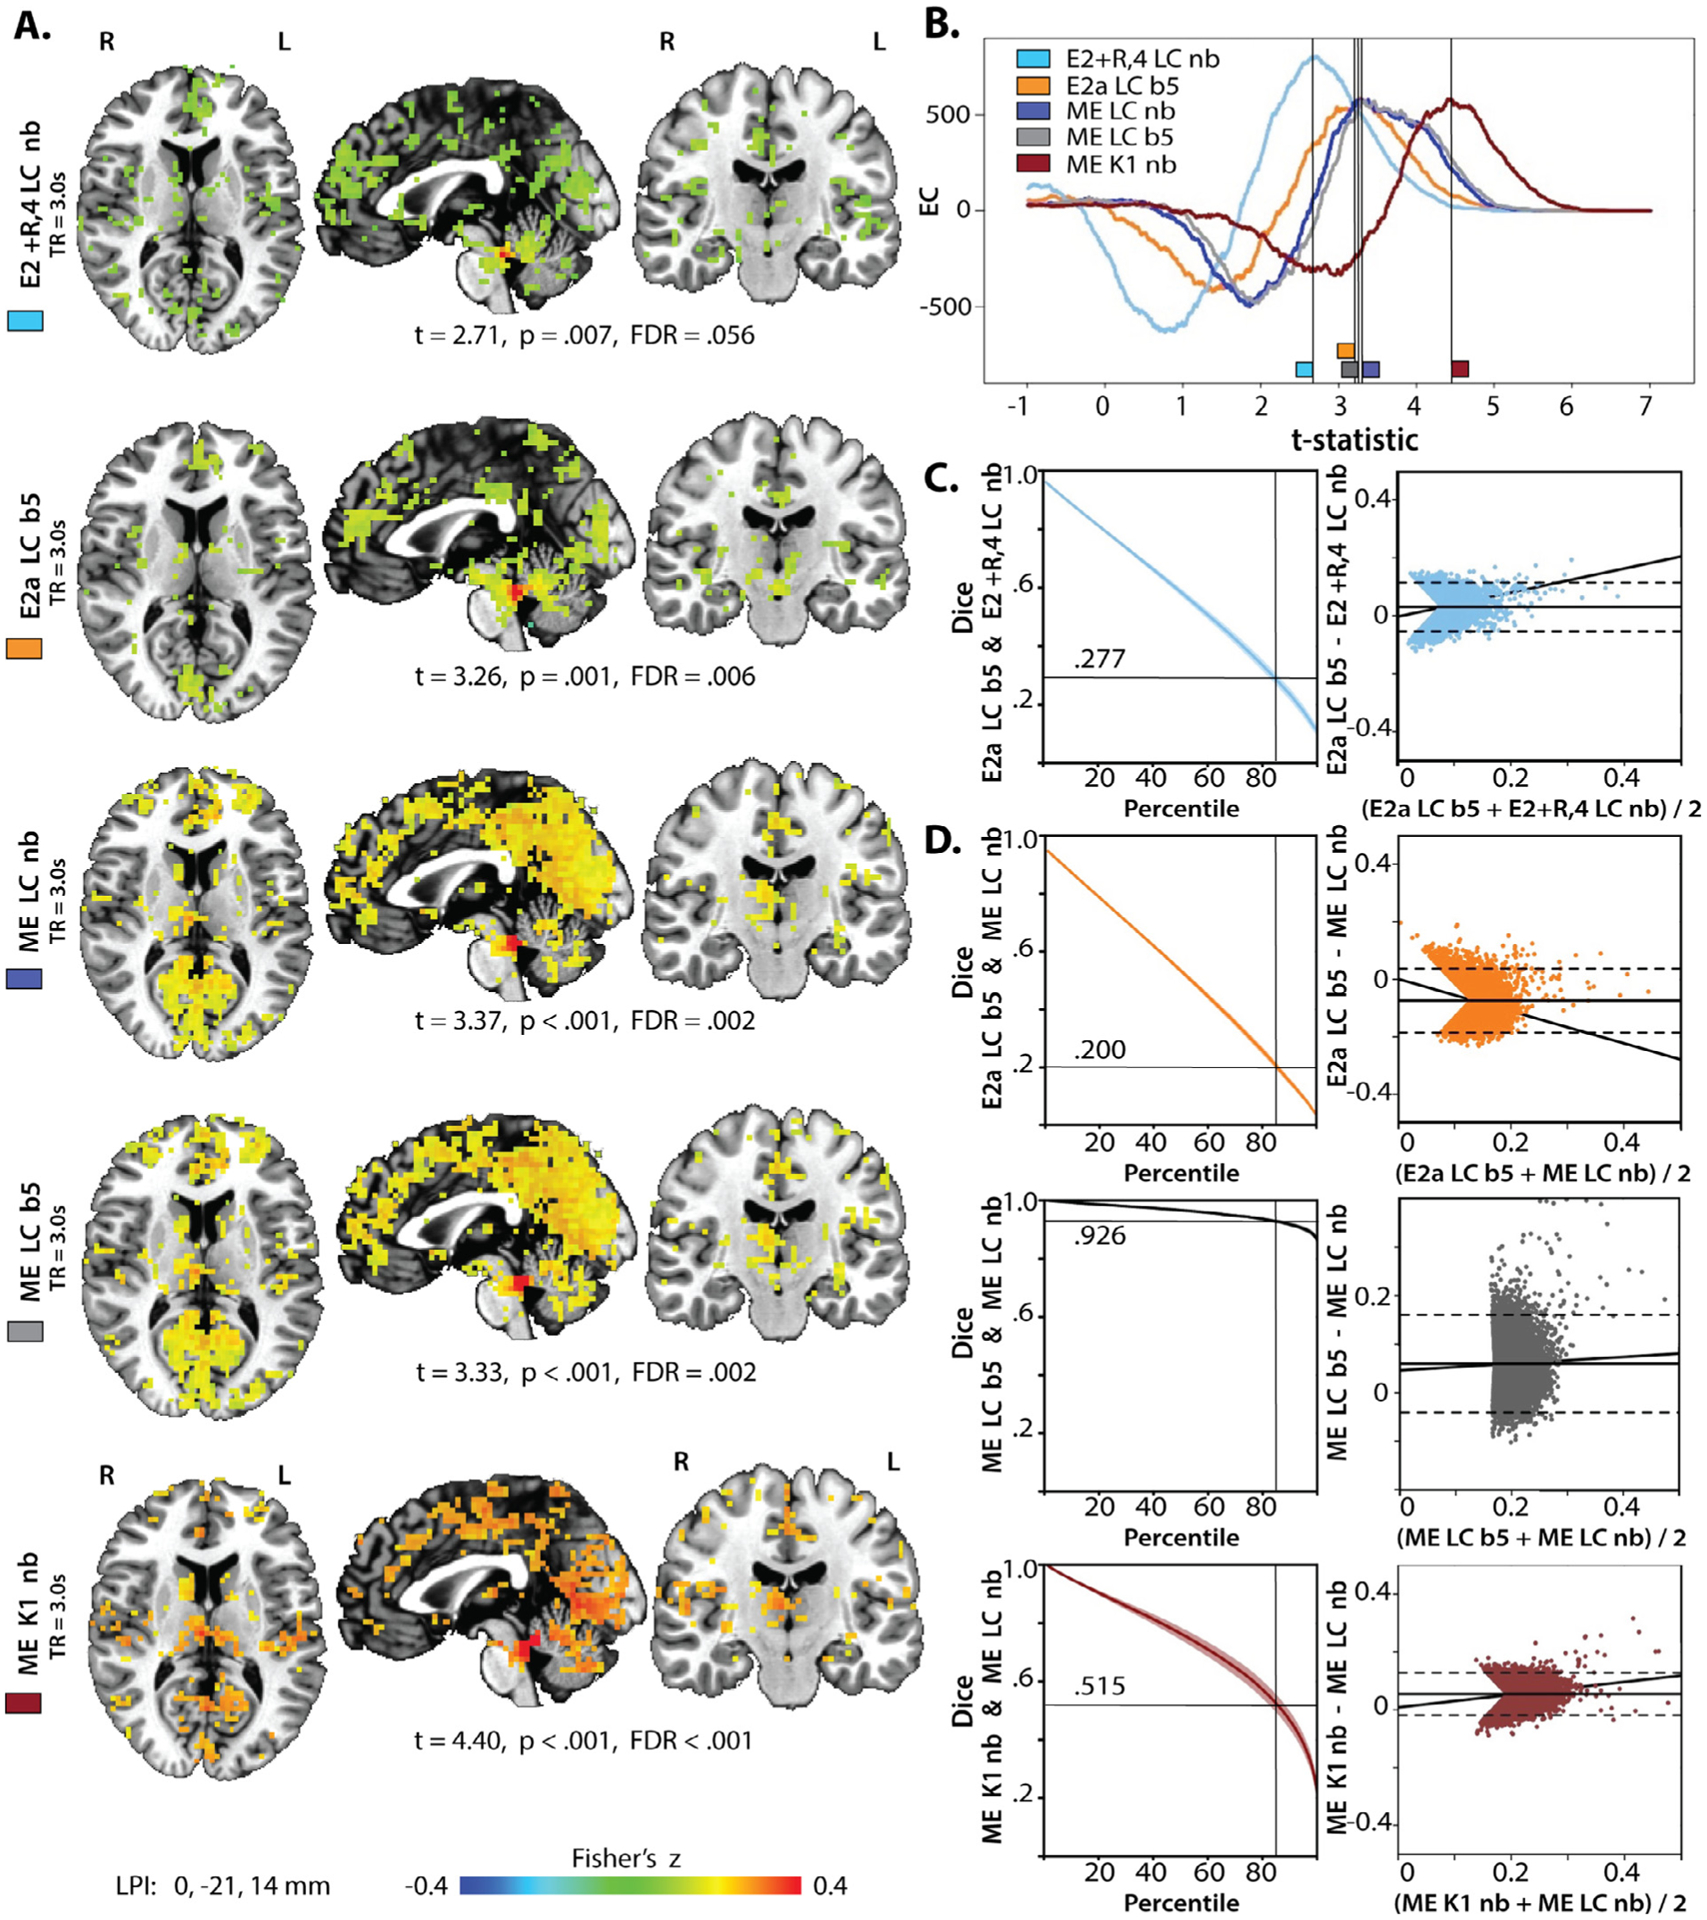
Intrinsic functional connectivity maps generated with five preprocessing pipelines. A) iFC maps for the different LC seeds with various ME and E2 pipelines. Maps were thresholded at the t-statistic with the maximum EC. B) EC for all iFC maps as a function of the t-statistic. C) Dice coefficients across percentiles and Bland-Altman plots comparing the E2 + R,4 pipeline to the E2a pipeline. Horizontal line indicates the 85th percentile. This served as the threshold for analyses reported in Tables 2–4 and for the Bland-Altman plots in the right column. Solid line: mean difference, dashed lines: +/−1.96 of the standard deviation of the differences. D) Dice coefficients and Bland-Altman plots to compare the ME LC nb iFC map against other preprocessing approaches. Note the smaller range on the ordinate axis for the comparison against ME LC b5.