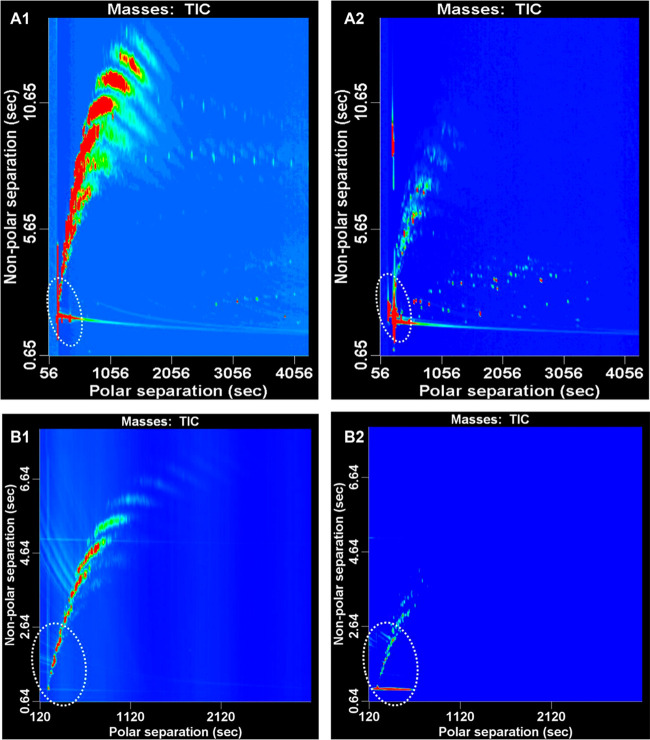
Figure 4.
Comparison between the contour plots obtained from the HPLC GC × GC–TOF-MS analysis of the (A1) saturate and (A2) unsaturate fractions and the SFC–GC × GC–TOF-MS analysis of the (B1) saturate and (B2) unsaturate fractions of the same kerosene sample. (The circle indicates the area of concern where HPLC mobile phase elutes.) Reprinted with permission from ref (58). Copyright 2013 American Chemical Society.

