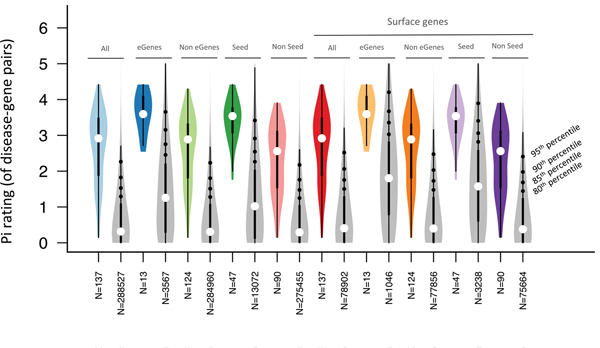
Extended Data Fig. 7 |. Drug target prioritization (Priority index, Pi) score of our drug targets candidates segmented by gene categories.
It is shown the distributions of the Pi-rating (computed in Fang et al., 42) of our candidate genes (colored boxplots) segmented for different gene categories (“All” genes, “eGenes”, “Seed” genes and cell surface genes) with the relative background distributions (grey boxplots, that is that consider all the genes belonging to the respective category). eGenes means that the gene has an eQTL colocalizing with the disease; seed gene means that the genes have a genetic link to the disease (by eQTL, gene proximity or chromatin conformation) as defined in Fang et al., 42. The boxplot inside the violin plot reports a white circle indicating the median value, with the box limits indicating the upper and the lower quartiles. The whisker at the upper side of the box extends to the minimum between the interquartile range (IQR) x 1.5 and the overall maximum value of the data. The whisker at the bottom side of the box extends to the maximum between IQR x 1.5 and the overall minimum value of the data.

