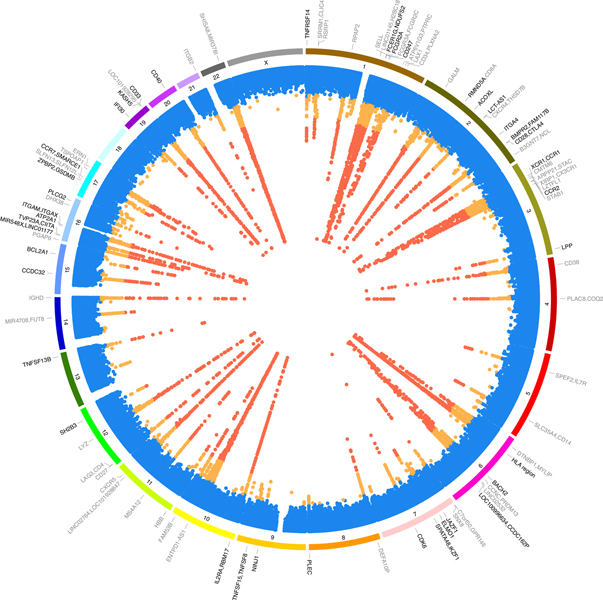
Fig. 2 |. Genetic associations of the immune traits assessed.
The innermost track shows the lowest association P value among all traits for each locus. Significant variants (P < 1.28 × 10⁻¹¹) are in red, suggestive variants (P value ranging from 5 × 10⁻⁸ to 1.28 × 10⁻¹¹) in orange, and non-significant variants in blue. The middle track shows the chromosome number. The outermost track indicates the genes nearest to signals with P < 1.28 × 10⁻¹¹. Genes showing coincident genetic association with diseases are shown in bold font. The coincident associated genes are indicated even if in some instances their P values range from 5 × 10⁻⁸ to 1.28 × 10⁻¹¹. The summary statistics were obtained using a linear mixed association model. The significance threshold was calculated by applying a Bonferroni correction to the empirical significance threshold (P = 6.9 × 10⁻⁹)6 considering 539 independent tests.

