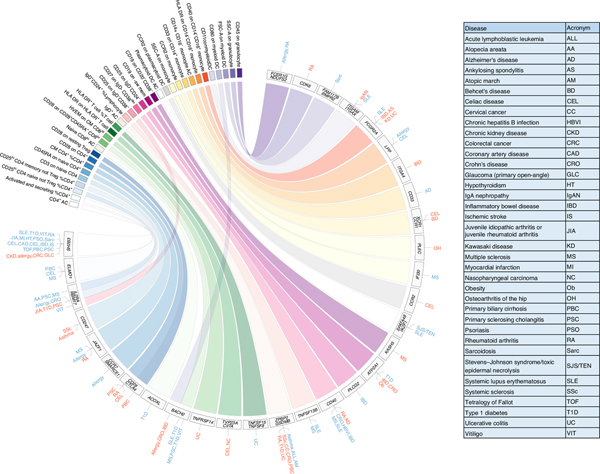
Fig. 3 |. Coincident genetic association between immune traits and diseases.
The circular plot shows the top immune traits in colored rectangles and the genes nearest the associated signals in gray rectangles. The pathologies linked to the immune traits via coincident genetic associations (P < 5.0 × 10⁻⁸) are listed radially to the associated gene. The pathologies for which the protective allele correlates with a reduction of an immune trait level are in blue, whereas those for which the protective allele correlates with an increase are in red. The HLA region is not included. The pathology acronyms are detailed in the table. The summary statistics for the immune traits were obtained using a linear mixed association model.

