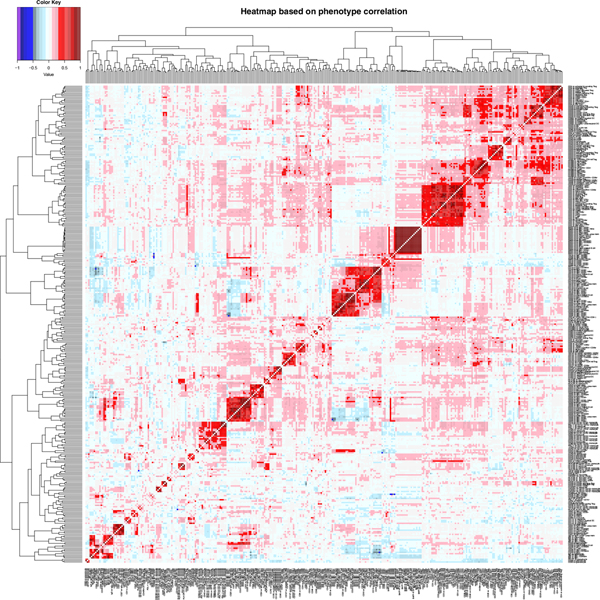
Extended Data Fig. 3 |. Phenotypic correlation among expression level of surface markers.
Heatmap of phenotypic correlations for MFI pairs calculated using the Spearman coefficient. Dendrograms represent the clustering: short branches indicate strong phenotypic correlation between traits, whereas long branches weak correlation. Color gradations represent the correlation strength, with red indicating direct correlation (from 0 to +1) and blue inverse correlation (from 0 to −1).

