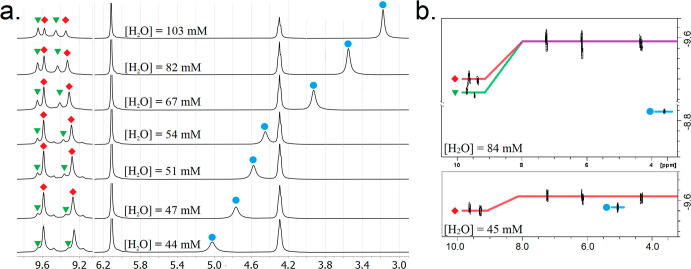
Figure 3.
Quantitative 1H NMR spectra (a) and DOSY diffusograms (b) of C11R6 (5.38 mM) observed over a range of water concentrations (44.12–103.01 mM) corresponding to 8–19 water molecules per C11R6 capsule. Water peaks and diffusion traces are highlighted in blue or accompanied by a blue circle. Peaks and diffusion traces attributed to C11R6-A (red highlight and diamond) and C11R6-B (green highlight and triangle) assemblies are annotated. Overlapping diffusion traces are shown in purple. Quantitation of water concentration was determined by integration of the water peak (blue circle) compared to a peak corresponding to both C11R6 assemblies (δ = 6.2 ppm, 24 H, 5.38 mM). Complete diffusograms are provided in the Supporting Information (Figure S4). Long recycle delays (25 s) were necessary to obtain quantitative spectra for both water (T1 = 0.7–0.9 s, data not shown) and C11R6 (T1 = 1.39 s, data not shown).

