
Figure 5.
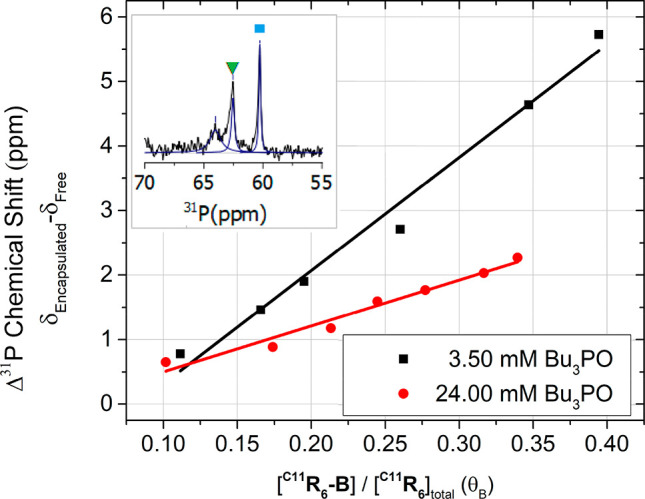
Chemical shift difference between free and encapsulated Bu3PO observed by 31P NMR at two concentrations, 3.50 mM (black) and 24.00 mM (red) in the presence of C11R6 (5.38 mM). Spectra were obtained at water contents spanning 43.76–110.19 mM (3.50 mM Bu3PO) and 43.05–86.53 mM (24.00 mM Bu3PO), which were subsequently converted to the proportion of C11R6-B (θB) by an empirical model (Figure S13). Inset, a 31P NMR spectrum showing peaks corresponding to encapsulated (▼, green) and free (■, blue) Bu3PO.