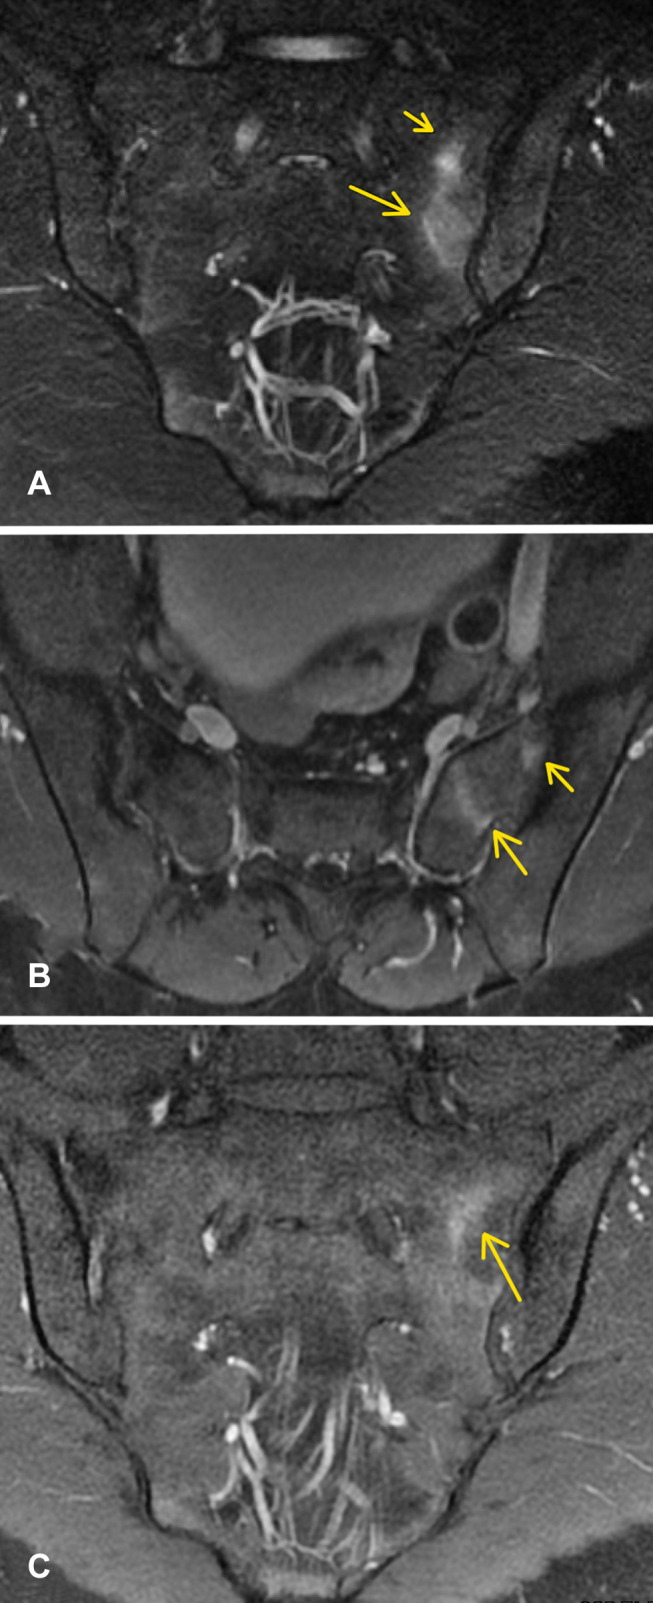
Figure 7.

(A) Coronal view sacral T2 MRI with enhancement depicted by yellow arrows. (B and C) Axial and coronal view T1 MRI, respectively, showing post contrast enhancement depicted by yellow arrows. When these findings are seen concurrently in a patient, it is representative of bone marrow edema, which can be a sign of sacroiliitis.
