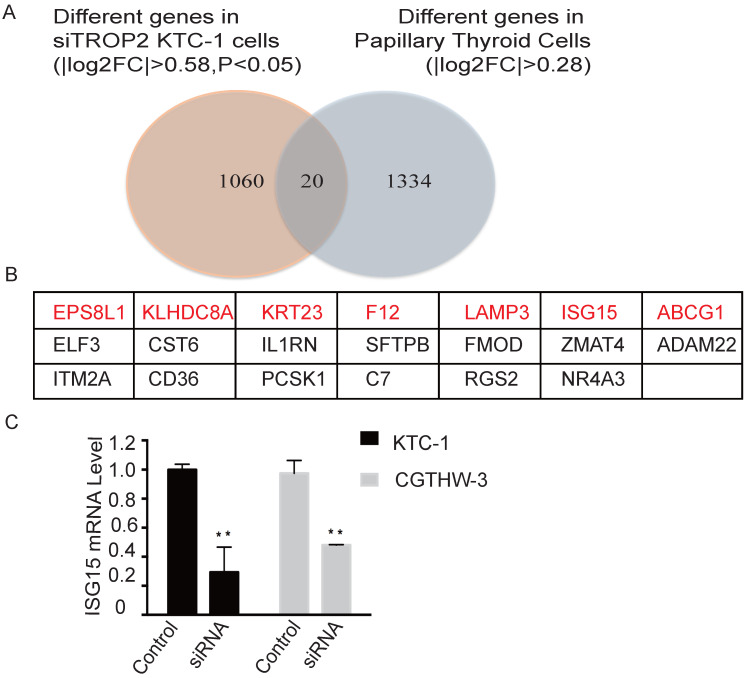
Figure 4.
TROP2 and ISG15 expression were significantly correlated in PTC patients. (A) Overlap of different genes in TROP2 siRNA KTC-1 cells and PTC. (B) The gene list of 20 overlapped common genes. The genes in red indicated that the genes were up-regulated in PTC and down-regulated in TROP2 siRNA KTC-1 cells. (C) ISG15 was down-regulated in TROP2 siRNA cells. Statistically significant differences are marked by an asterisk (*P < 0.05; **P < 0.01, ***P ≤ 0.001).

