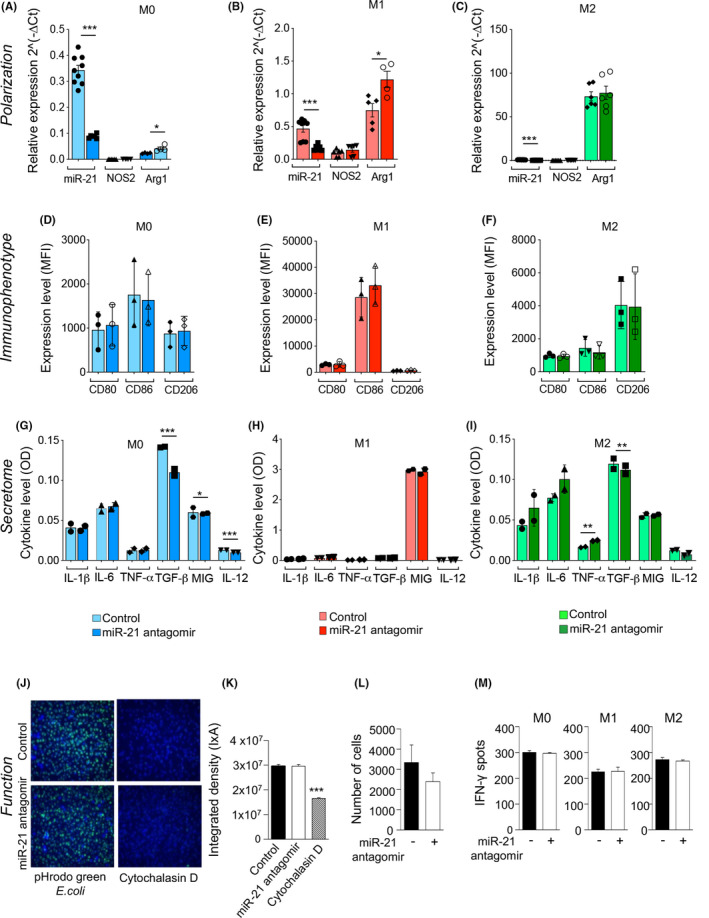
FIGURE 5.

miR‐21 antagonism reshapes macrophages profiles in vitro. (A–C) In vitro challenge with miR‐21 antagomir skewed bone marrow‐derived macrophages (BMDMs) to express Arg1. M0, M1, and M2 macrophages were analyzed by (A–C) qRT‐PCR for miR‐21 and Arg1 (U6snRNA and HPRT were used as housekeeping genes), (D–F) by FACS analysis for CD80, CD86, CD206 markers gated on CD11b+F4/80+ cells (at least n = 3 samples per group) and (G–I) by ELISA for cytokine expression levels. (J–M) miR‐21 antagomir has no effect on phagocytosis (J–K), migration (L), or antigen‐presenting cell capacity analyzed with Elispot (M) of macrophages. Data are expressed as mean ± standard error of the mean (SEM). Statistical significance was performed by Student's t test with Welch's correction (if applicable) (*p < .05; **p < .01; ***p < .001). ELISA, enzyme‐linked immunosorbent assay; FACS, flow cytometric analysis; miRNAs, micro‐RNA; qRT‐PCR, real‐time quantitative reverse transcription polymerase chain reaction [Color figure can be viewed at wileyonlinelibrary.com]
