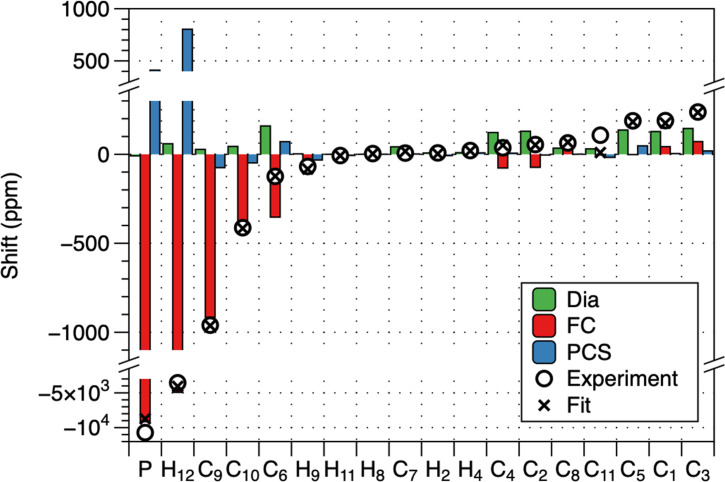
Figure 5.
Contributions to the paramagnetic shifts at 295 K. The theoretical diamagnetic shift (M06‐L/6‐31G(d)) is shown in green, the Fermi contact contribution in red, the PCS is shown in blue (based on TPSSH/def2‐TZVP computed hyperfine tensors and best‐fit magnetic susceptibility tensor). The total calculated chemical shift (crosses) are compared with the experiment (circles).

