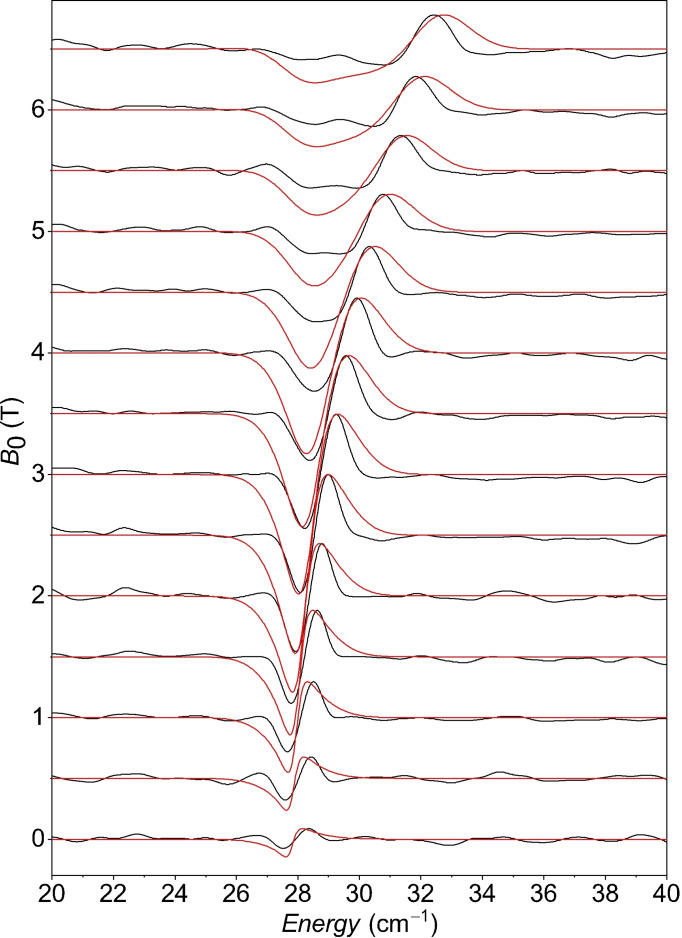
Figure 9.
Experimental (black) and simulated (red) FD‐FT THz‐EPR magnetic division spectra (MDS) of pressed powder samples of 1 measured at T=5 K. MDS for different external magnetic fields B 0 are obtained by dividing the raw spectrum measured at B 0 by the spectrum measured at B 0 + 1 T. Data is shown offset for B 0 and rescaled with a global normalisation factor. In MDS, EPR resonances appear as negative (EPR resonance at B 0) and positive (EPR resonance at B 0 + 1 T) deviations from 1. Simulations with Eq. (8) were obtained with D=−54.5 cm−1, |E|=13.89 cm−1, (|E/D|=0.25), g ⊥=1.65, g ∥=2.63.

