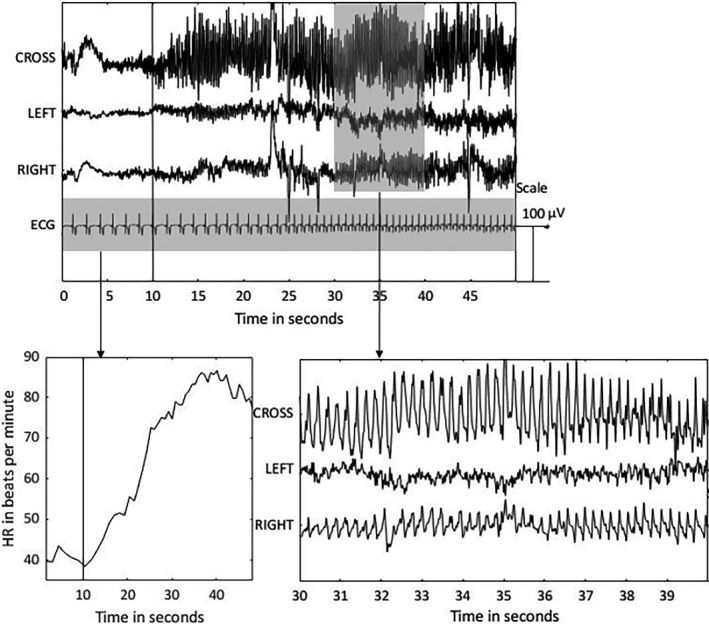
FIGURE 1.

The behind‐the‐ear electroencephalogram (EEG) and electrocardiogram (ECG) are shown during a temporal focal impaired awareness seizure from the right hemisphere. The top panel contains four channels: crosshead (CROSS), left channel, right channel, and ECG. The amplitude of the ECG signal is decreased by a factor 10. The seizure onset is depicted with a vertical black line at 10 s. The bottom left panel shows the extracted heart rate (HR) in beats per minute during the seizure. A heart rate increase from 40 to 80 beats per minute is observed. The bottom right panel shows a close‐up of the behind‐the‐ear EEG channels during 20–30 s after the seizure onset
