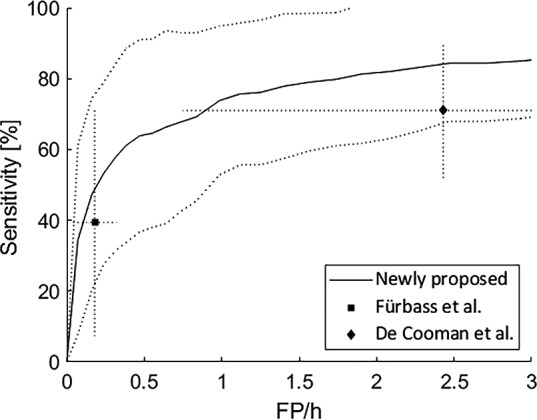
FIGURE 5.

Performance comparison of our proposed electrocardiography‐based seizure detection algorithm. The sensitivity versus false alarm rate (FAR) is plotted together with the standard deviation on the sensitivity (dotted lines). The sensitivity and FAR are shown for two state‐of‐the‐art solutions: Fürbass et al. 22 and De Cooman et al. 16 The dotted lines indicate the standard deviation in two directions: the FAR and sensitivity. FP, false positives
