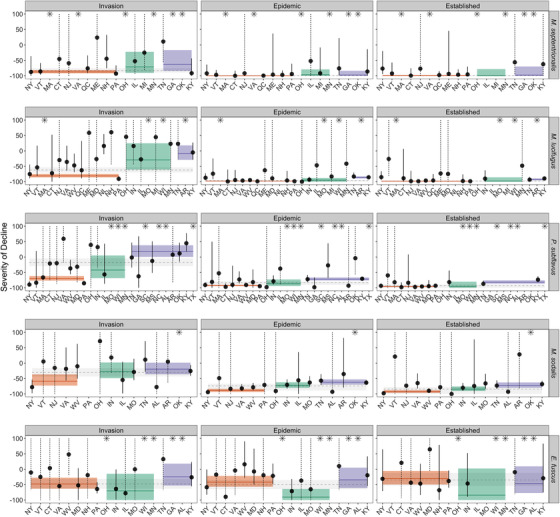
FIGURE 4.

Regional and state or province estimates of percent change (points), relative to prearrival of white‐nose syndrome (WNS), in winter counts for 5 bat species in hibernacula (vertical lines, 95% credible intervals; *, states or provinces for which sample size was insufficient [1 site] to estimate severity; dotted lines, credible interval exceeds 100% growth and 100% mortality; colored lines, regional estimates; colored bands, 95% credible intervals; orange, northeast; green, Midwest; purple, southeast; dashed gray lines, study‐wide estimates of proportional change in winter counts; gray bands, 95% credible intervals). For purposes of representing results by region, Quebec and Newfoundland are included in the northeast and Oklahoma and Texas are included in the southeast
