
Figure 2.
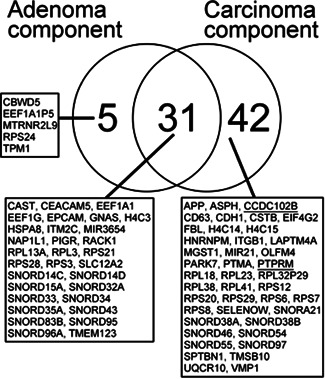
Global transcriptome analysis of the isolated adenomatous and carcinomatous glands. The right circle of the Venn diagram shows the abnormally expressed genes in the adenomatous glands compared with the normal glands, and the left circle shows the abnormally expressed genes in the carcinomatous glands compared with the normal glands. The central overlapping circle indicates the abnormally expressed genes common to both the adenomatous and carcinomatous glands