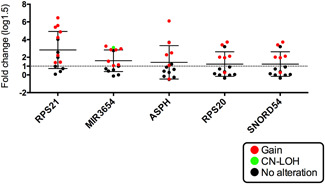
Figure 3.

Expression levels of pooled mRNA in array‐based tests of isolated adenomatous and cancerous glands. Different patterns of somatic copy number alterations (SCNAs) are marked by different colors connecting copy number levels and gene expression levels. Red, gain; Blue, loss of heterozygosity (LOH), green, copy‐neutral LOH and black, no alteration
