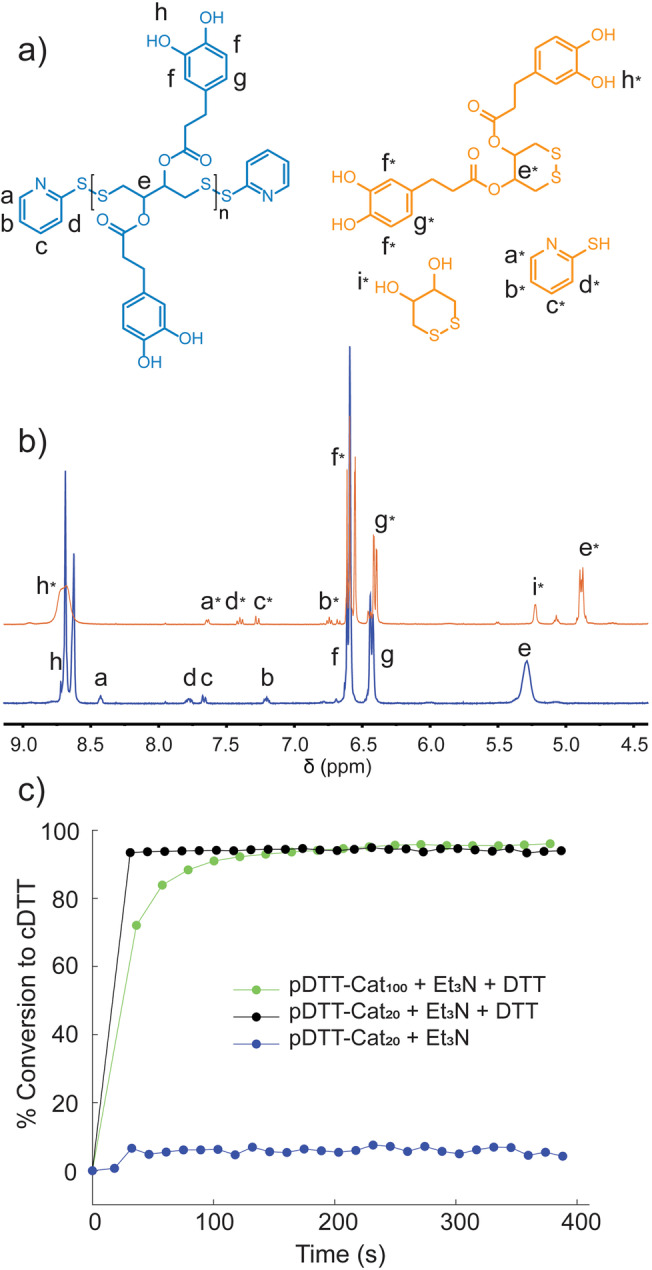
Figure 2.

a) Chemical structure of depolymerization products from pDTT‐Cat100. b) 1H NMR of pDTT‐Cat100 (blue) and pDTT‐Cat100 depolymerized in presence of 1 equiv DTT and 0.5 equiv Et3N with respect to polymer end‐caps (orange) in DMSO‐d 6. c) Conversion of polymers, pDTT‐Cat100 (green), and pDTT‐Cat20 (black) to cyclic monomer in response to adding 1 equiv DTT and 0.5 equiv Et3N, along with the response of adding only 0.5 equiv Et3N to pDTT‐Cat20 (blue), measured by 1H NMR spectroscopy (lines to guide the eye). In all measurements the polymer concentration was 1.6 mm.
