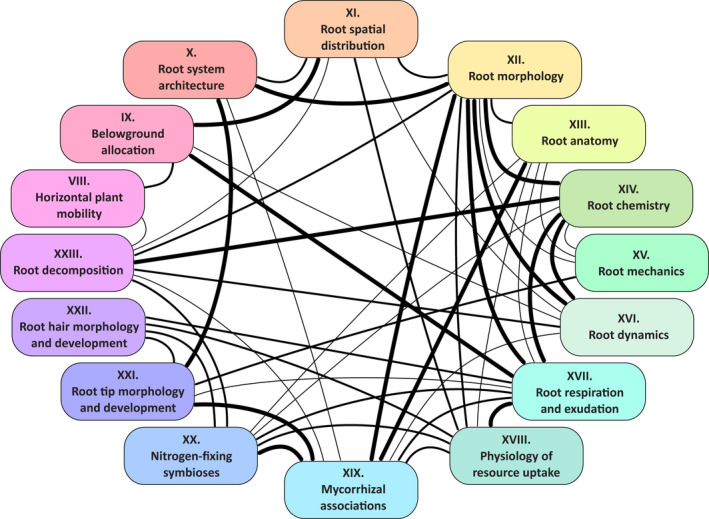
Fig. 1.

Map of trait categories included in this guide and approximate frequency at which these categories have been studied together. While not all categories are necessarily relevant to study together, this diagram can be used to identify the (lack of) connections between these ‘fields’ of research. The width of connectors depicts weak‐to‐strong linkages between categories. No connector, no or very few studies looking at both fields jointly; thin connectors, few studies; medium connectors, fields sharing substantial number of studies; thick connectors, fields that are frequently studied together. This diagram represents the authors’ expert assessment only and is imperfect as no exhaustive review of the literature was carried out.
