Fig. 7.
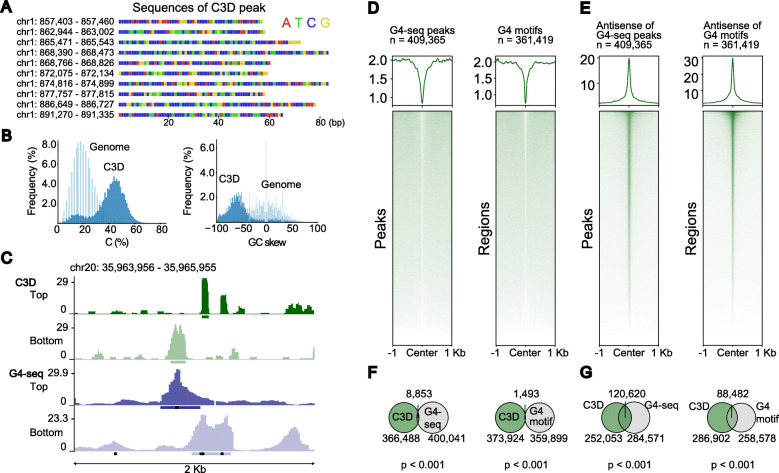
One-third of C3D peaks are complementary strands of G4 motifs. A Nucleotide sequences of representative C3D peaks are displayed using color-coding. B Distribution of C-content (left) and GC-skew (right) are shown for C3D peaks (blue) and 50-mers randomly picked from the reference genome sequence (light blue). C A genome browser shot for C3D and G4-seq [35]. The reads mapped to the top and bottom stands are displayed in separate tracks. Horizontal bars at the bottom of each track indicate MACS2-called peaks. The black dots at the bottom of tracks indicate the putative G4 sequences identified using the quadparser algorithm [46]. D, E Aggregation plots of C3D read coverage on the peaks of G4-seq (left) and the putative G4 sequences identified using the quadparser algorithm (right). The results are shown for the G4-containing strand (D) and its antisense strand (E). F, G Venn diagrams indicating the overlap of C3D peaks with G4-seq peaks (left) and G4-motifs (right). The results are shown for the G4-containing strand (F) and its antisense strand (G)

