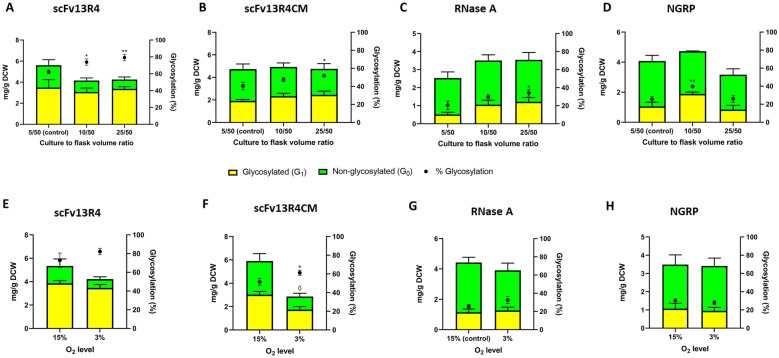
Fig. 5.
Effect of culture conditions and oxygen availability upon target protein glycosylation in E. coli. A–D Effect of culture to flask volume ratio (oxygen transfer efficiency) upon target protein glycosylation in E. coli. Quantitative Western blot analysis (densitometry) of A scFv13R4, B scFv13R4CM, C RNase A and D non-disulphide control protein NGRP located in periplasm of glyco-competent E. coli in shake flask under three different cultures to flask volume ratio (5:50, 10:50, and 25:50 ml). E–H Quantitative Western blot analysis (densitometry) of E scFv13R4, F scFv13R4CM, G RNase A and H NGRP control non-disulphide bond-containing protein, detected in the periplasm of glyco-competent E. coli under different oxygen levels culture (3% and 15% O2). A–H Total proteins were quantified using pre-determined purified scFv13R4CM, RNase, or NGRP standard curve (5 ng to 100 ng). The data were converted into mg/g of dry cell weight (DCW) based on normalisation and calculation with measured OD600 of the samples. A–H Glycosylated (yellow bar) and non-glycosylated (green bar) protein as shown (left y-axis). % Glycosylation (% G1/G0 + G1) is indicated (black circle, right y-axis). Statistical analysis was conducted by unpaired t-test with Welch’s correction to control sample at lowest culture to flask volume ratio 5:50 (A–D) or to control normoxic culture (E–H) (P < 0.05*, < 0.01**, for % glycosylation; P < 0.05◊, for total protein mg/g DCW). All data were processed from three biological replicates. Error bars indicate standard deviation from mean values

