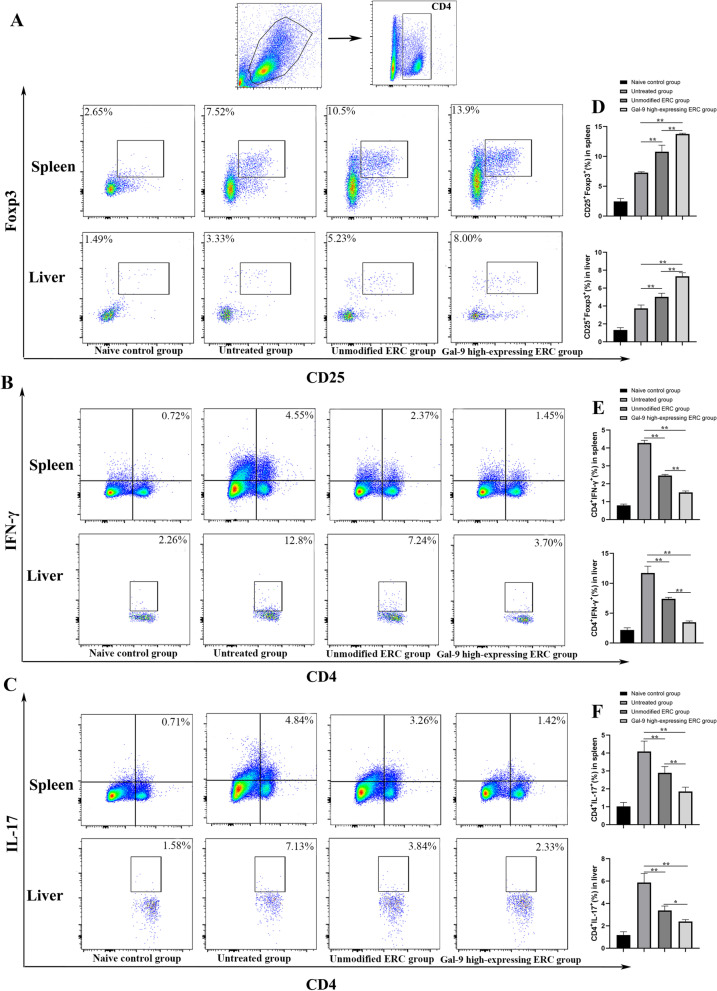
Fig. 4.
Gal-9 mediates ERCs to reduce Th1 and Th17 cell differentiation, but improve Treg population in vivo. Single-cell suspensions were obtained from the spleen and liver. Cells were stained with anti-mouse CD4, IFN-γ, IL-17, CD25, Foxp3 antibodies. A Representative dot plots depict the percentage of Tregs (CD4+CD25+Foxp3+) in the spleen and liver. B Representative dot plots depict the percentage of Th1 (CD4+IFN-γ+) cells in the spleen and liver. C Representative dot plots depict the percentage of Th17 (CD4+IL-17+) cells in the spleen and liver. D Percentage of Tregs in spleen and liver. E Percentage of Th1 cells in spleen and liver. F Percentage of Th17 cells in spleen and liver. The differences between groups were calculated using ANOVA. *p < 0.05, **p < 0.01. Abbreviations: Treg regulatory T cells, ANOVA one-way analysis of variance

