
Fig. 3.
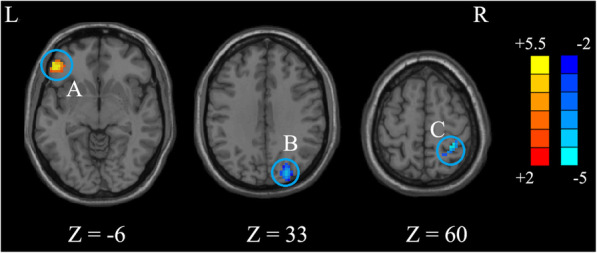
Brain functional differences between NP-PBD and HCs (p < 0.05, AlphaSim corrected). The color scale represents t values. (A) the left Orbital IFG; (B) the right SOG; (C) the right Postcentral gyrus
Official websites use .gov
A
.gov website belongs to an official
government organization in the United States.
Secure .gov websites use HTTPS
A lock (
) or https:// means you've safely
connected to the .gov website. Share sensitive
information only on official, secure websites.
Brain functional differences between NP-PBD and HCs (p < 0.05, AlphaSim corrected). The color scale represents t values. (A) the left Orbital IFG; (B) the right SOG; (C) the right Postcentral gyrus