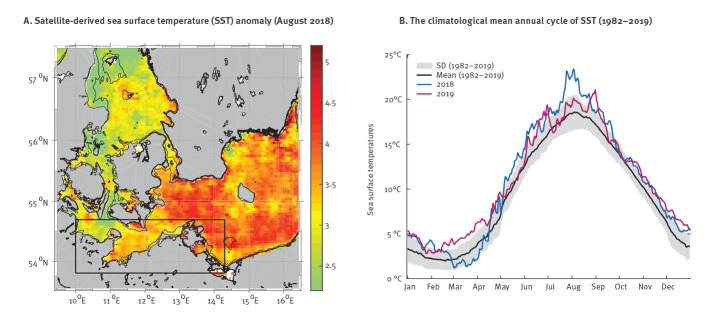
Figure 4.
Sea surface temperatures in the south-eastern Baltic Sea in 2018 and 2019
4A: Satellite-derived sea surface temperature (SST) anomaly in August 2018 with a reference to the climatological mean between 1982 and 2001. The thin black line shows the water depth of 10 m and reveals the shallow coastal areas. 4B: The climatological mean annual cycle of SST (black) based on data between 1982 and 2019 and averaged within the black rectangular box in 4A with the standard deviation underlaid as a grey shadow. The annual SSTs between 2018 and 2019 are shown in blue and pink as indicated in the legend.

