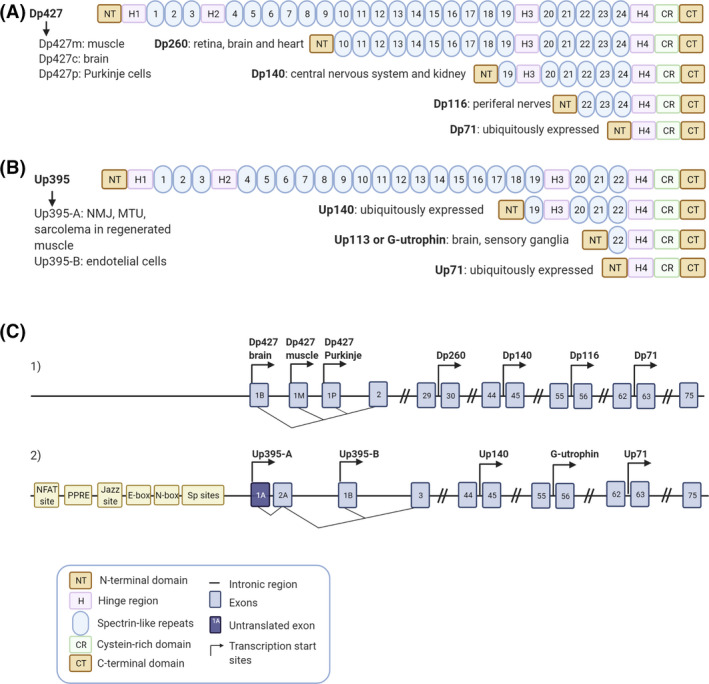
FIGURE 1.

Dystrophin and utrophin isoforms. Schematic representation of the full length and truncated dystrophin (A) and utrophin (B) protein isoforms including their most representative expression in tissues. (C1 and C2) Blue boxes show the specific exons, the black line represents the intronic regions and the transcription start sites of the different promoters are indicated by arrows within the dystrophin (C1) and the utrophin (C2) gene. (C1) Full‐length dystrophin expression is driven by three promoters Dp427 brain, muscle and Purkinje and the smaller isoforms are produced from four internal promoters, Dp260, Dp140, Dp116 and Dp71. (C2) Full‐length utrophin expression is driven by two promoters Up395‐A and Up395‐B and the smaller isoforms are produced from three internal promoters Up140, G‐utrophin and Up71. Different elements of the utrophin A promoter are also specified in the panel. Created with BioRender.com
