
FIGURE 2.
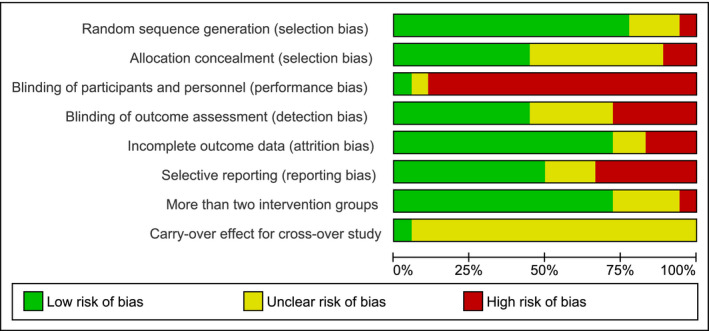
Risk of bias graph: review authors' judgments about each risk of bias item presented as percentages across all included studies. Performance bias was overall high (89%) as a result of the difficulties in blinding no‐treatment groups. The item ‘carry‐over effect for cross‐over studies' was scored frequently (94%) as ‘unclear risk’ due to the low amount of cross‐over trials (k = 1)