
FIGURE 5.
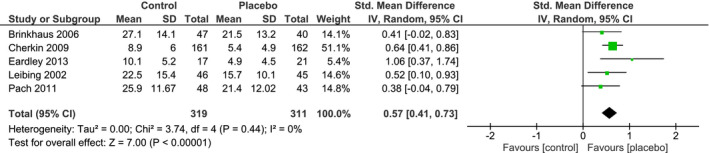
Forest plot of the random‐effects meta‐analysis showing the amount of disability improvement in placebo groups versus no‐treatment groups in clinical treatment studies. Positive values for the Standardized Mean Difference indicate lower post‐intervention pain ratings in the placebo group than in the no‐treatment group