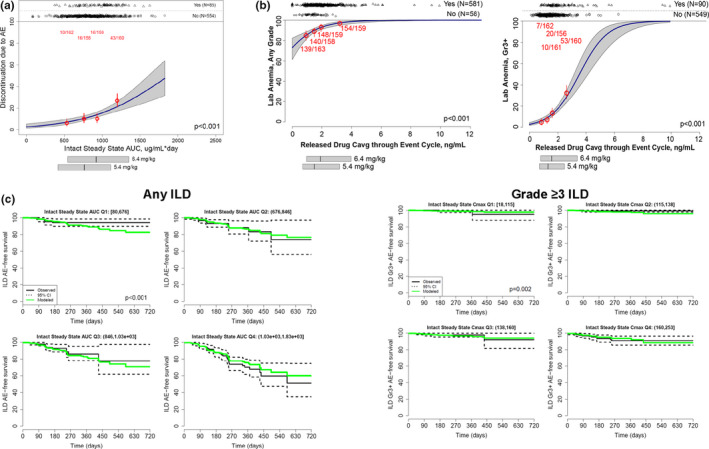
Figure 3.

Logistic regression plots of discontinuations associated with AEs (a) and anemia (b) and Cox regression plots of ILD (c). In panels a and b, numbers in red represent n/N; horizontal bars below the plot illustrate the 5th, 50th, and 95th percentiles of exposures. In panel c, the solid black line represents the estimated Kaplan‐Meier curves, the dashed lines are 95% CIs, and the solid green line represents the estimated Kaplan‐Meier curve determined using multivariate Cox regression. AE, adverse event; AUC, area under the concentration‐time curve; Cavg, average concentration; CI, confidence interval; Cmax, maximum concentration; ILD, interstitial lung disease; Q, quartile.
