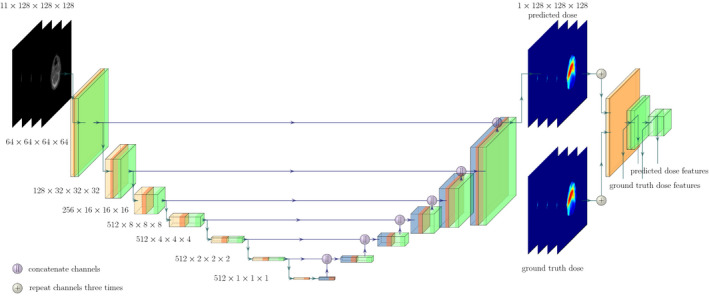
Fig. 1.

The final U‐Net model with ResNet blocks (green), 4 × 4 convolutions (orange) and transposed convolutions (blue). Purple dots represent the feature map concatenation. Note that the blocks represent the output of the respective operations given by the color. On the right side of the predicted dose, the pre‐trained ResNet model can be seen where the feature outputs are extracted from different depths for the predicted and the ground truth dose distribution. Please note that the ResNet blocks of the U‐Net and the pre‐trained classifier differ in architecture.
