Fig. 2.

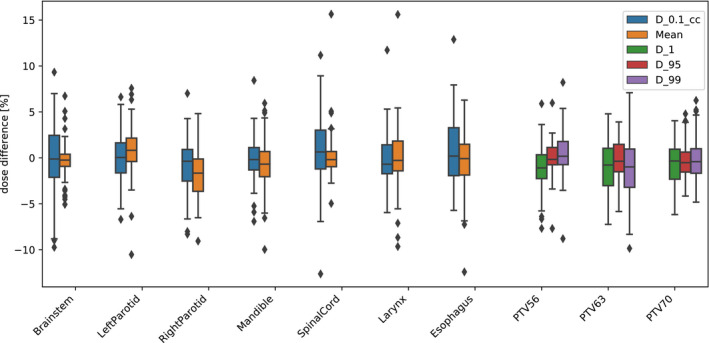
The colored dose parameters for the test dataset for all organs at risks and target structures. The boxes indicate median and interquartile range (IQR) and the whiskers extend to 1.5 times the IQR. Outliers are denoted by diamonds.

The colored dose parameters for the test dataset for all organs at risks and target structures. The boxes indicate median and interquartile range (IQR) and the whiskers extend to 1.5 times the IQR. Outliers are denoted by diamonds.